HomePage News 2022 Consumer Outlook Survey
Sizing Up Housewares Purchase Intent Category By Category
The first annual HomePage News Consumer Outlook Survey, commissioned in partnership with the International Housewares Association, was fielded recently to help suppliers and retailers pinpoint home and housewares opportunities in the coming year.
Consumer home and housewares purchasing was supercharged during the pandemic as fundamental shifts in living directed unprecedented surges in traffic in stores and online for products that facilitated and enriched home lifestyles.
A big question as the pandemic inches closer to its end is how the recalibrated balance of homebound and outbound living will impact consumer purchase considerations and priorities in the home and housewares space.
Suppliers and retailers are planning now to develop and curate the right mix of products as consumer home goods purchase motivation moves from more transactional to more aspirational, to be influenced by a wider range of differentiating variables.
The first annual HomePage News Consumer Outlook Survey, commissioned in partnership with the International Housewares Association, was fielded recently to help suppliers and retailers pinpoint home and housewares opportunities in the coming year.

The inaugural HomePage News Consumer Outlook report reveals key purchase intent findings from an online survey by Morning Consult of some 4,000 U.S. adults between November 15 and November 18, 2021. The survey was weighted based on several demographic variables to approximate a target sample of adults most likely to purchase home and housewares products. Results from the full survey have a margin of error of plus or minus 2 percentage points.
Through detailed charts and exclusive analysis, the comprehensive report reveals consumer purchase decision factors in 15 core home and housewares categories:
- Bakeware
- Cleaning Tools
- Cookware
- Cutlery
- Dinnerware
- Drinkware
- Flatware
- Floor Care Electrics
- Glassware
- Home Environment
- Kitchen Electrics
- Kitchen Textiles
- Kitchen Tools & Gadgets
- Personal Care & Wellness
- Storage & Organization
For each of these core categories, the survey reveals which housewares products consumers plan to buy; how much they expect to pay; retail channels in which they expect to shop; and key product attributes and lifestyle factors expected to influence their purchase choices.
The margin of error is shrinking when it comes to securing share in a retail market reshaped by the collision of fast-evolving product development, merchandising and marketing innovation in a global pandemic. This has tuned shoppers spanning multiple generations to their personal lifestyles and purchasing priorities like never before.
The HomePage News 2022 Consumer Outlook serves up a detailed guide that can be used in the coming year by home and housewares suppliers and retailers to bring informed insight and precision to their strategic efforts to sustain high demand, inspire purchasing and optimize consumer satisfaction in the home and housewares industry.
Bakeware
As consumers continue to turn their attention to finding comfort at home, baking has surged as a popular pastime. For many consumers, baking offers an escape from troubles, provides a challenge on which to focus and, in the end, creates something to enjoy and share with family and friends in person and on social media.
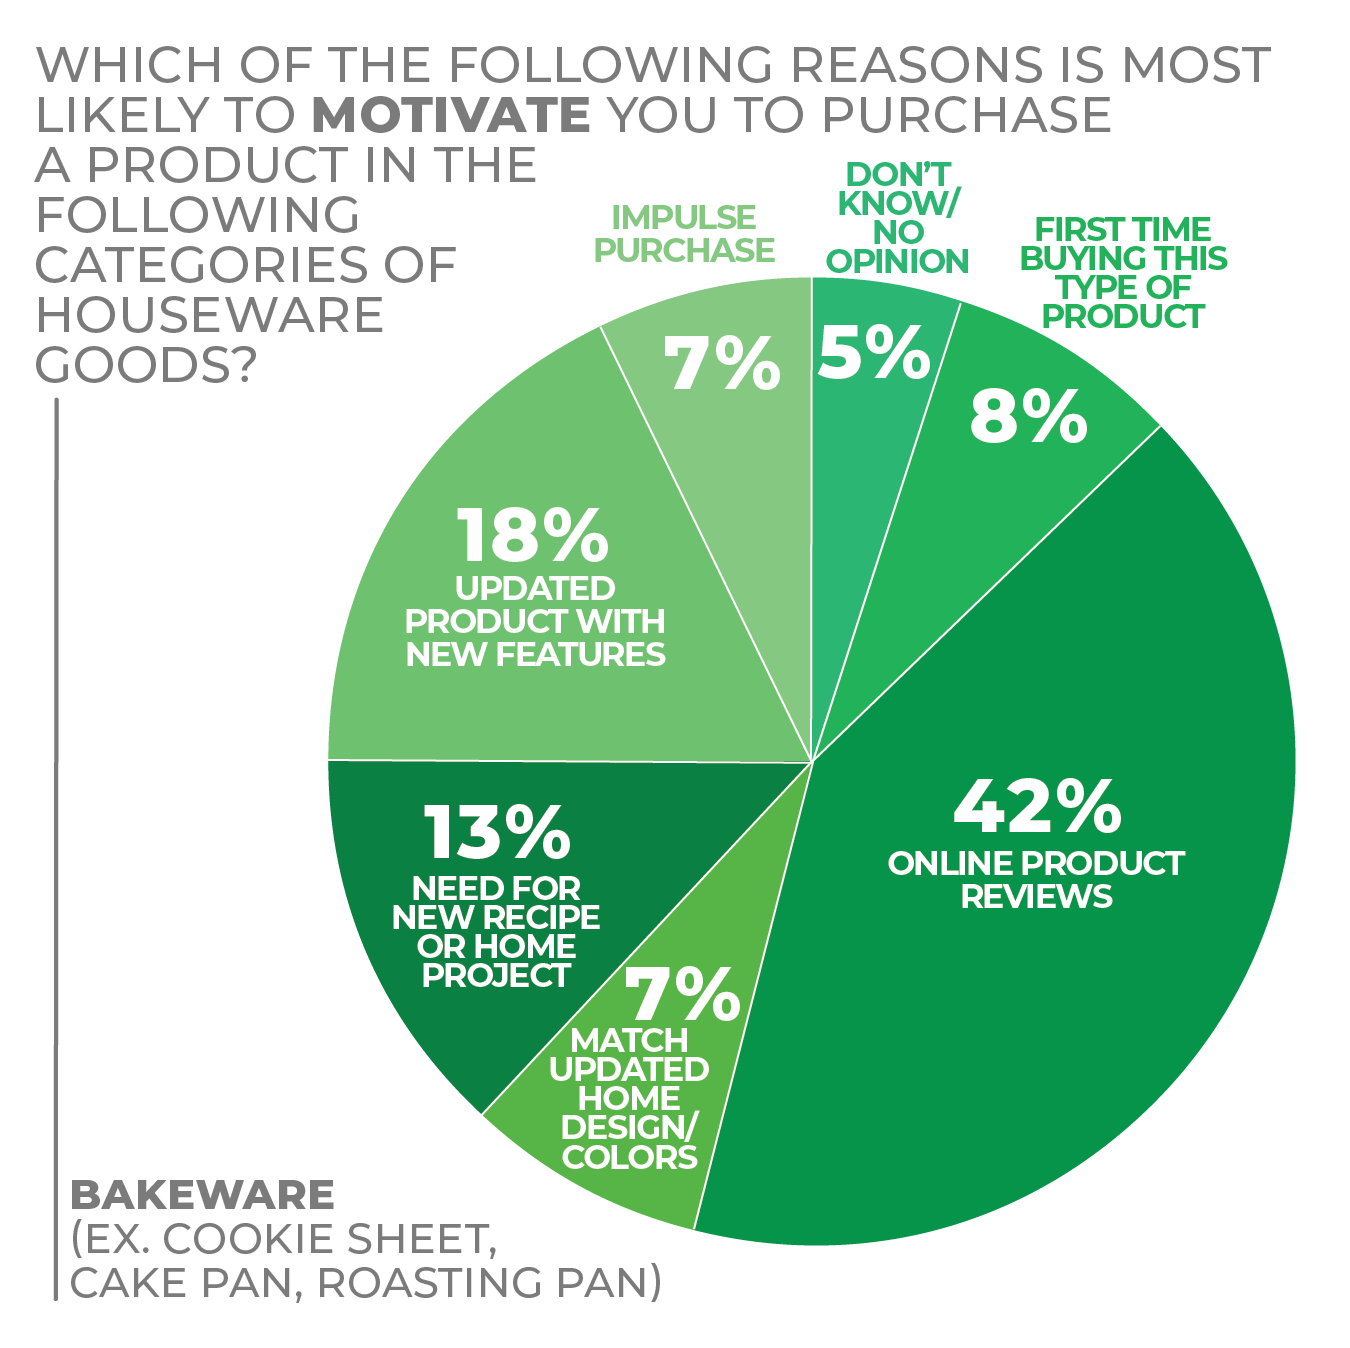
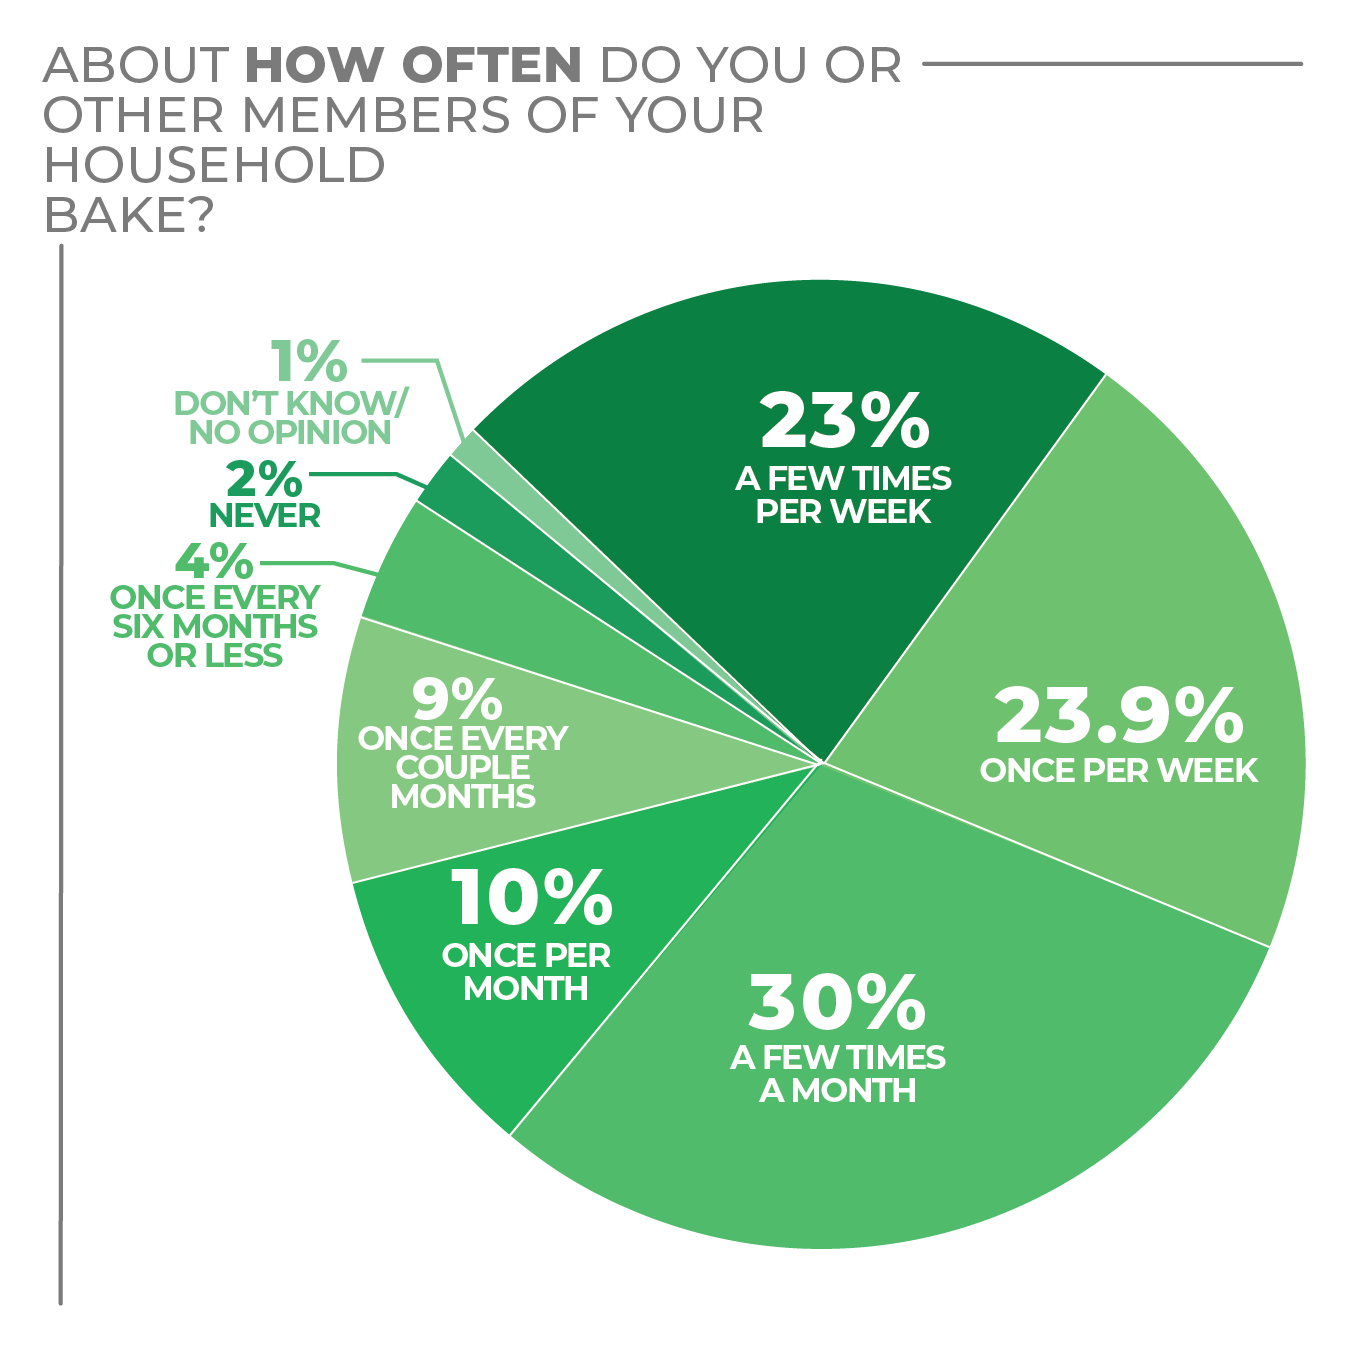
According to the recent HomePage News 2022 Consumer Outlook Survey, when asked how often they or members of their household bake, nearly 70% of respondents answered at least once a month, with 31.3% stating a few times a month. As such, the bakeware category continues to thrive, especially as respondents stated they are regularly purchasing new pieces to replace old or broken ones (42%) and are gravitating toward upgrading their current bakeware with products offering new features (18%) and/or the need for a new recipe or home project (13%).
These responses reflect an increase not only in at-home baking, but also in trying new recipes spotted on social media or shared by friends and family. For example, at the early onset of the pandemic, baking sourdough bread became a viral trend that had many consumers seeking new pans. Outside of the pandemic, baking trends were already pointing to healthier versions of favorite baked goods, such as donuts, brownies and cakes, as well as savory recipes, such as egg muffins.
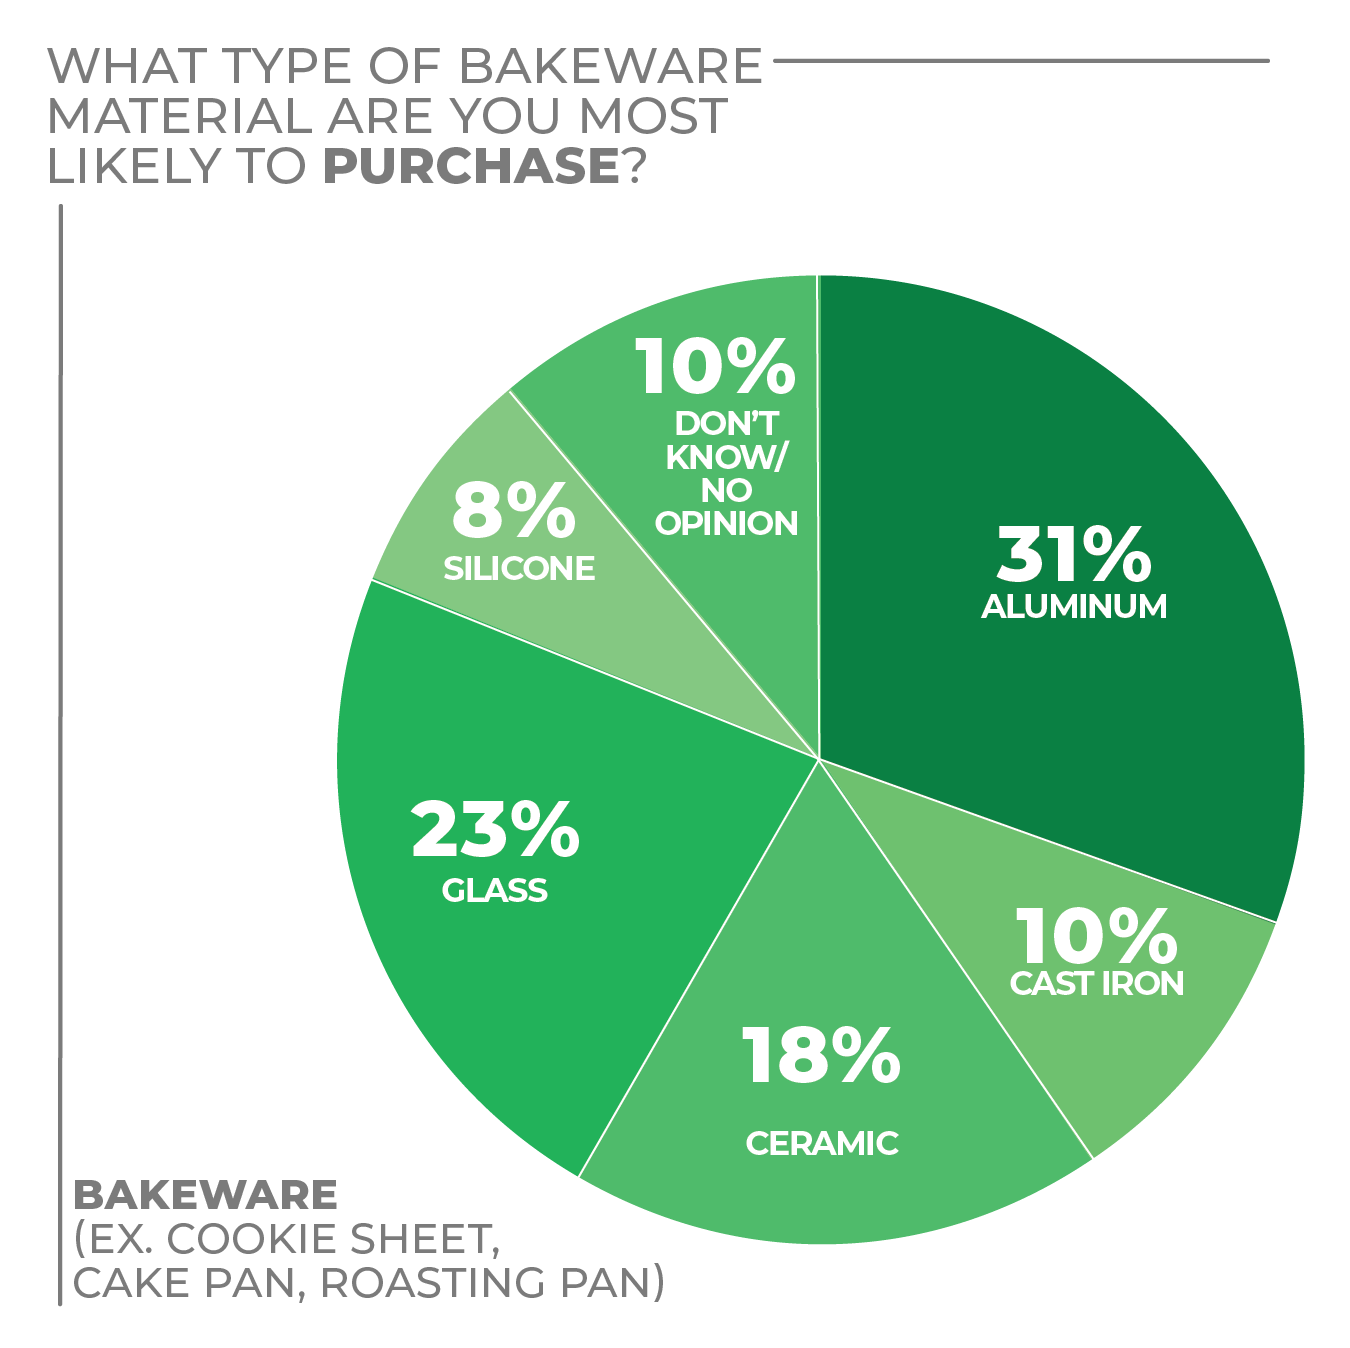
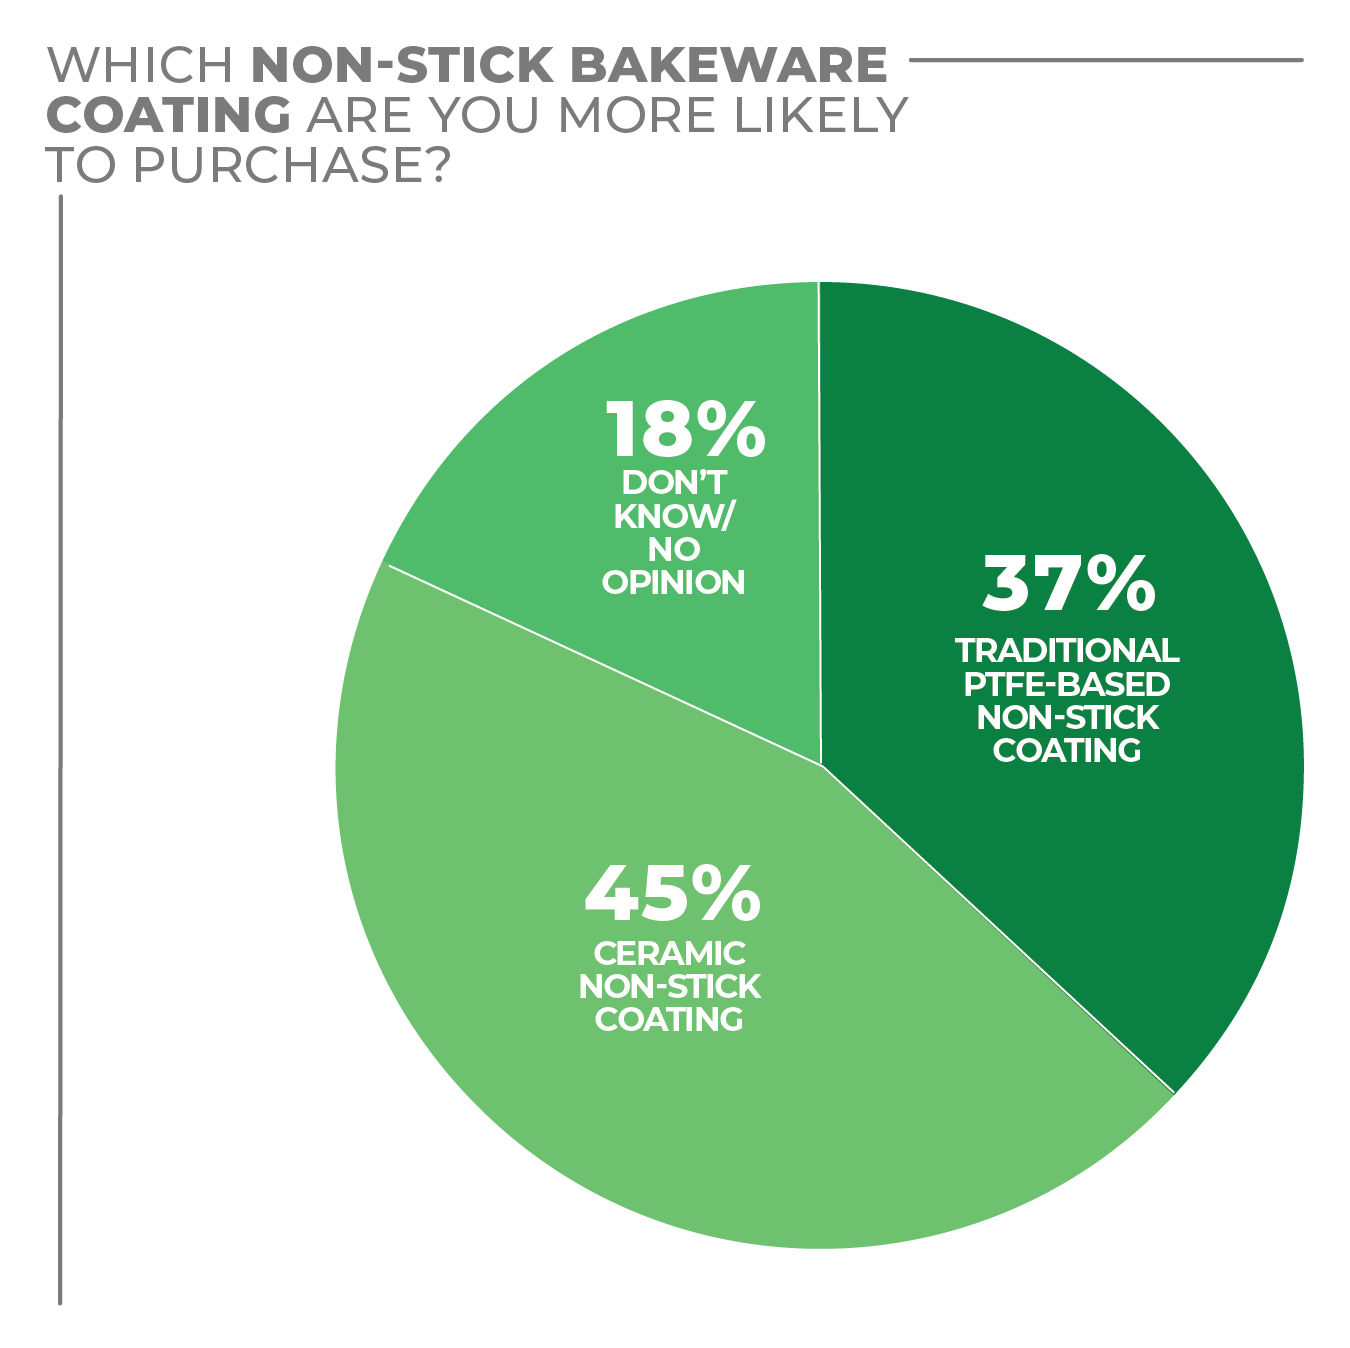
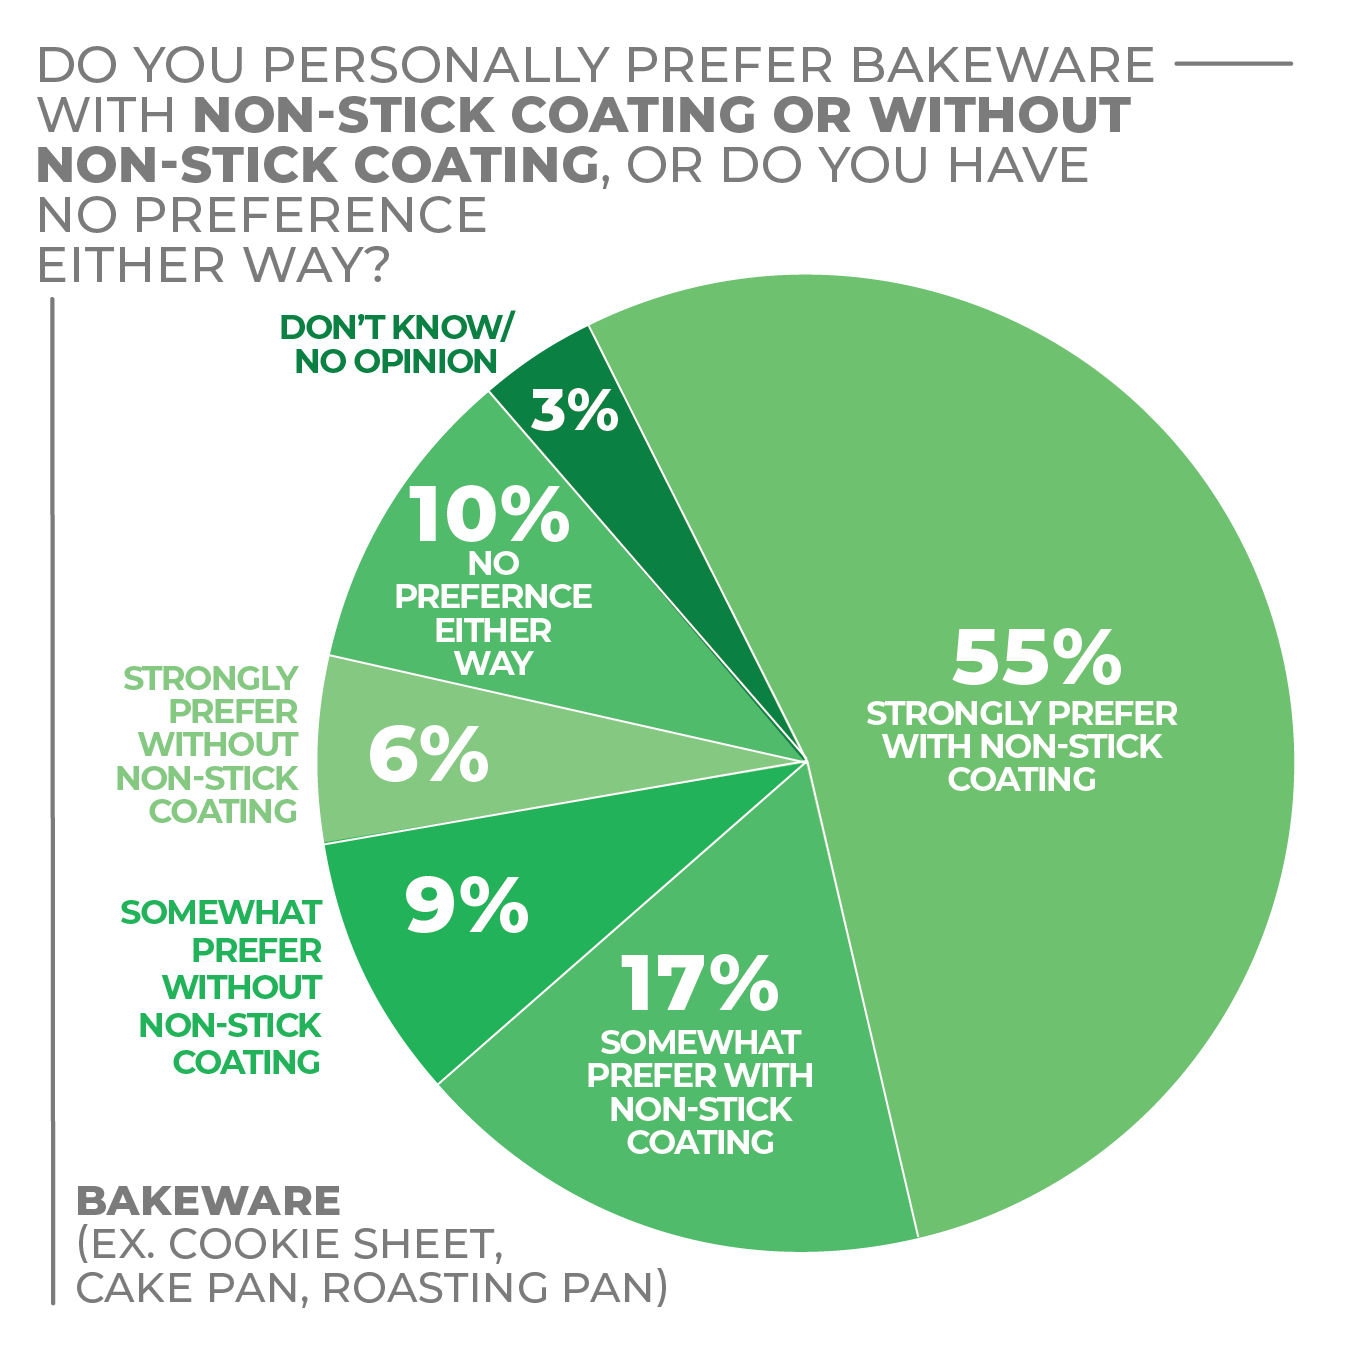
When it comes to material selection, consumers continue to embrace aluminum as their top choice at 31%, with glass (23%) and ceramic (18%) rounding out the top three selections. As for the type of coating consumers prefer, ceramic non-stick bakeware leads as the top preference, with 45% of respondents stating it was their material of choice, while 37% cited traditional PTFE-based non-stick coating.
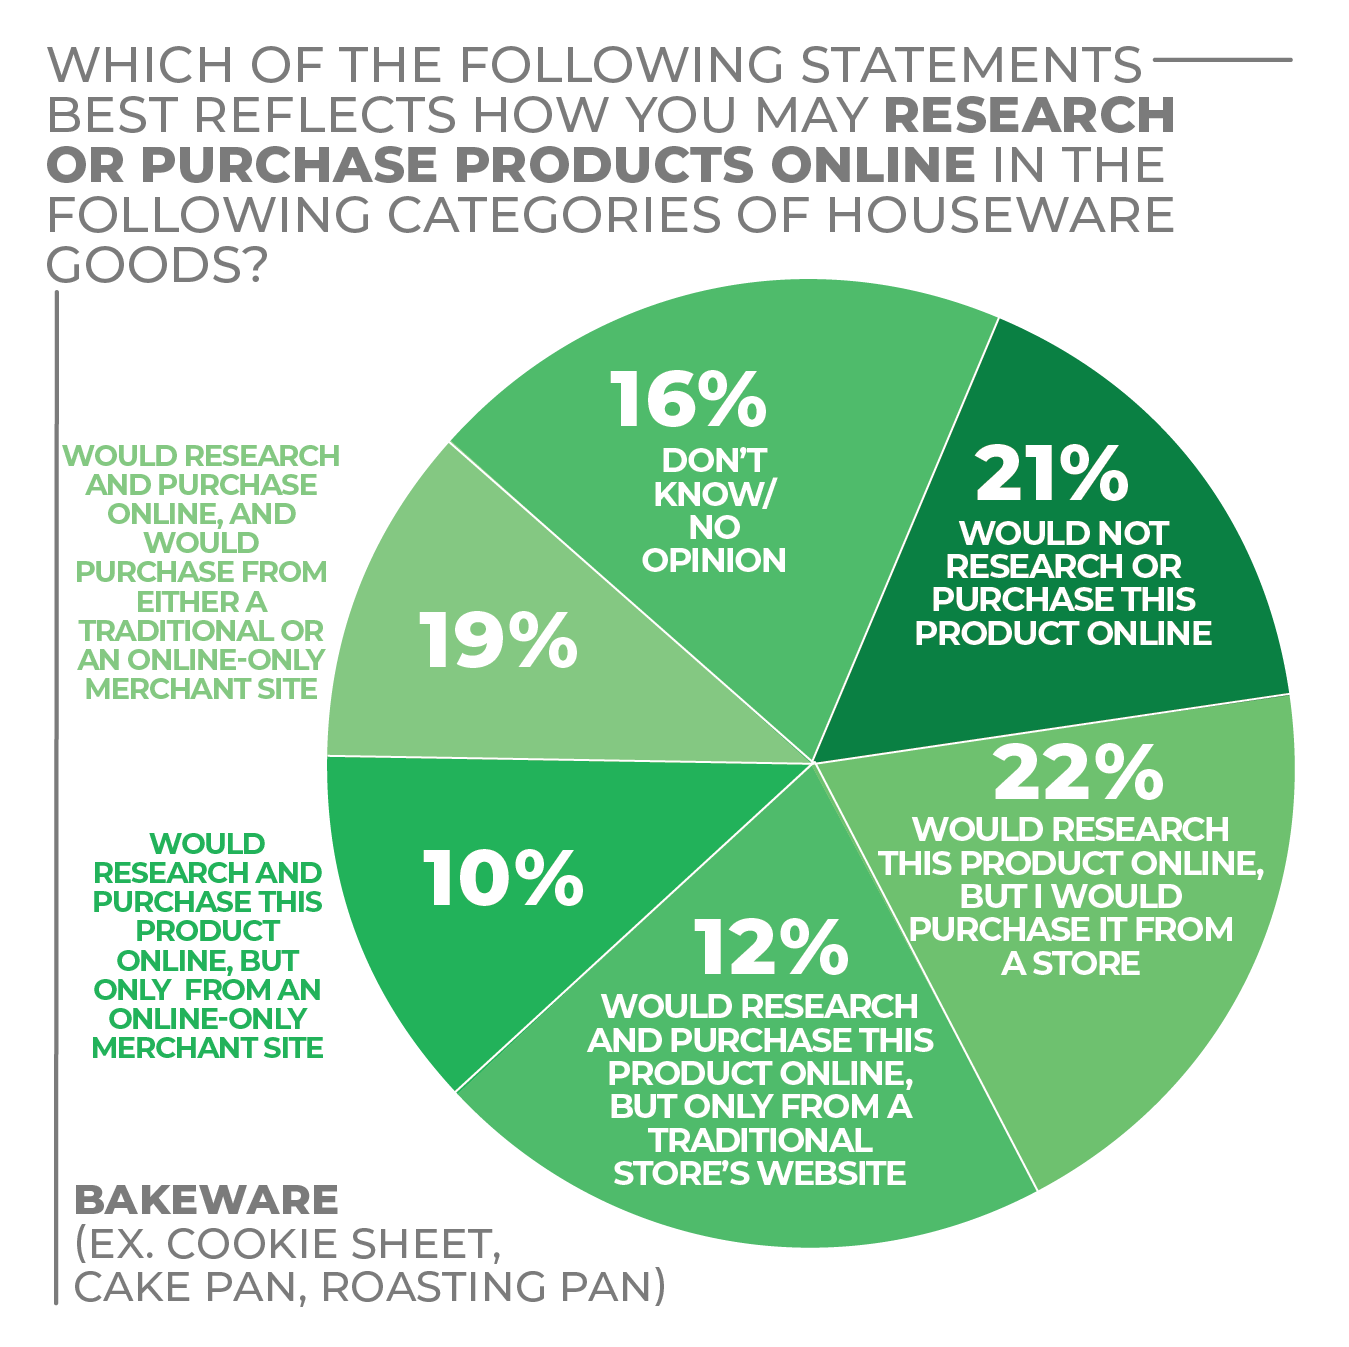
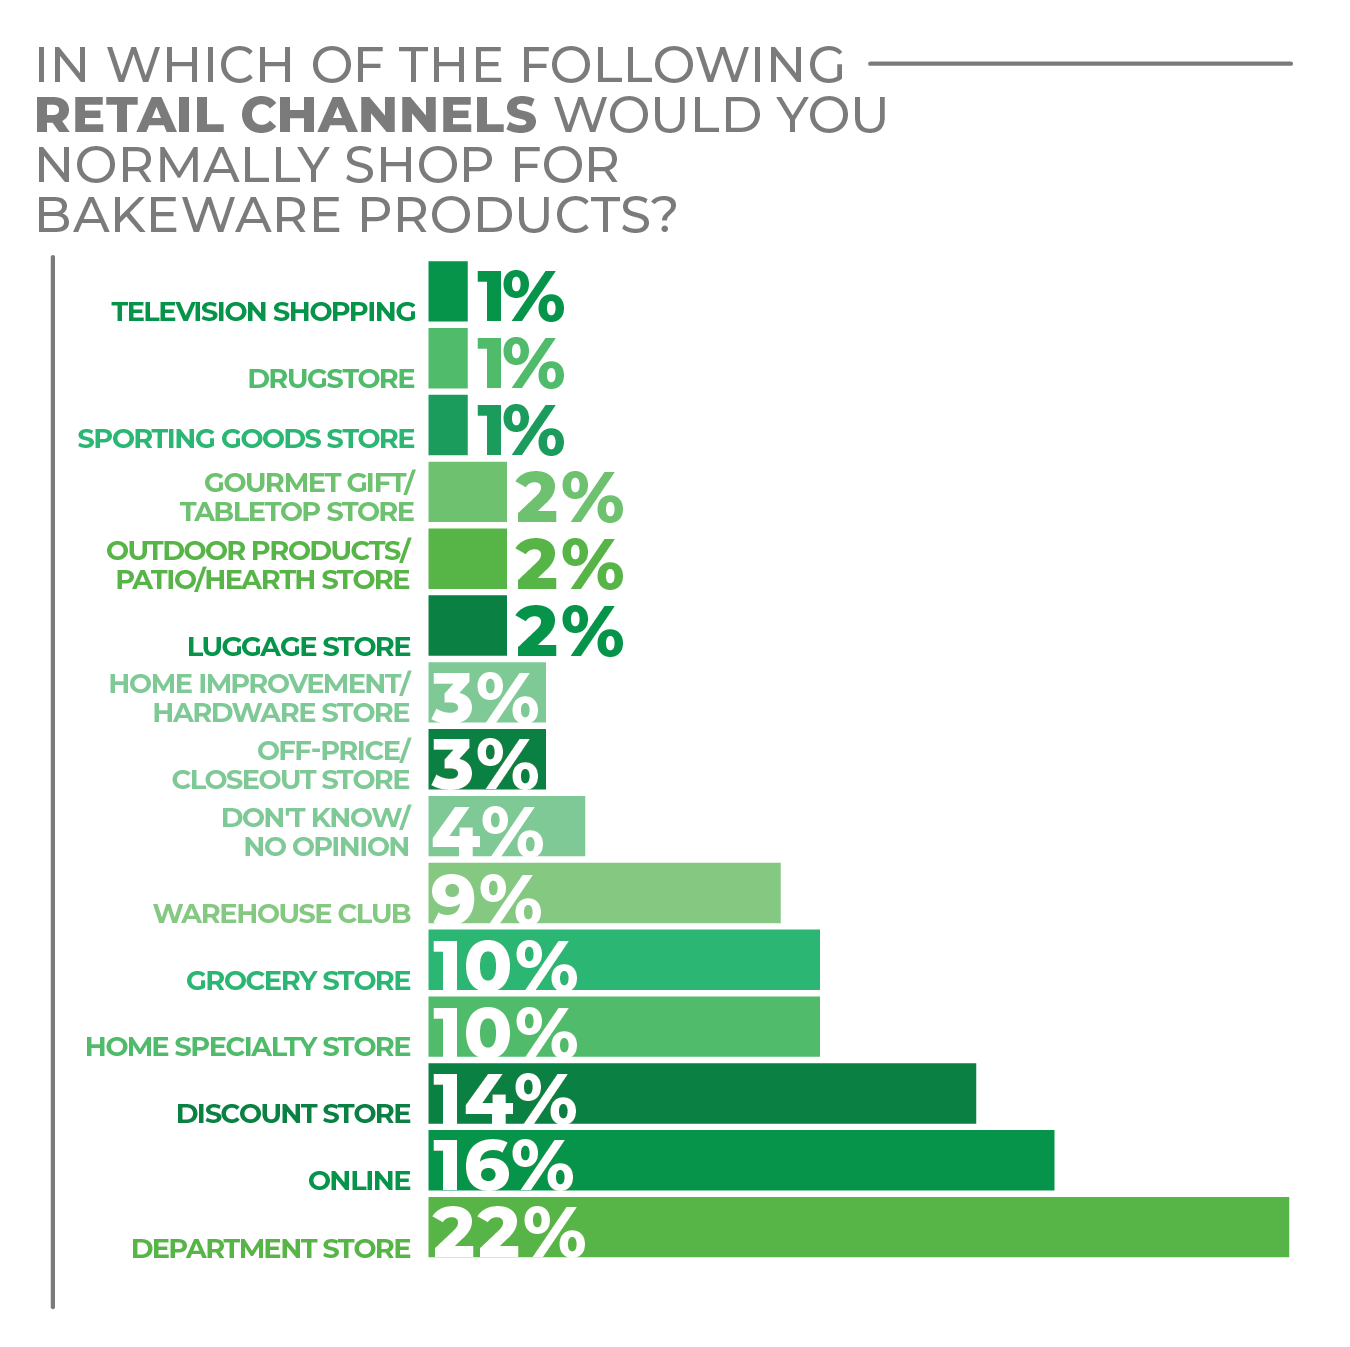
For consumers shopping for new bakeware, department stores and discount stores lead with a combined 36% of respondents selecting one of those as their preferred retail channel, while 16% stated they would shop online.
As consumers continue their baking endeavors, the bakeware category is well-positioned for robust sales through 2022.
- Consumers are busy baking — 23.9 % of survey respondents stated they or someone in their household bakes at least once a week.
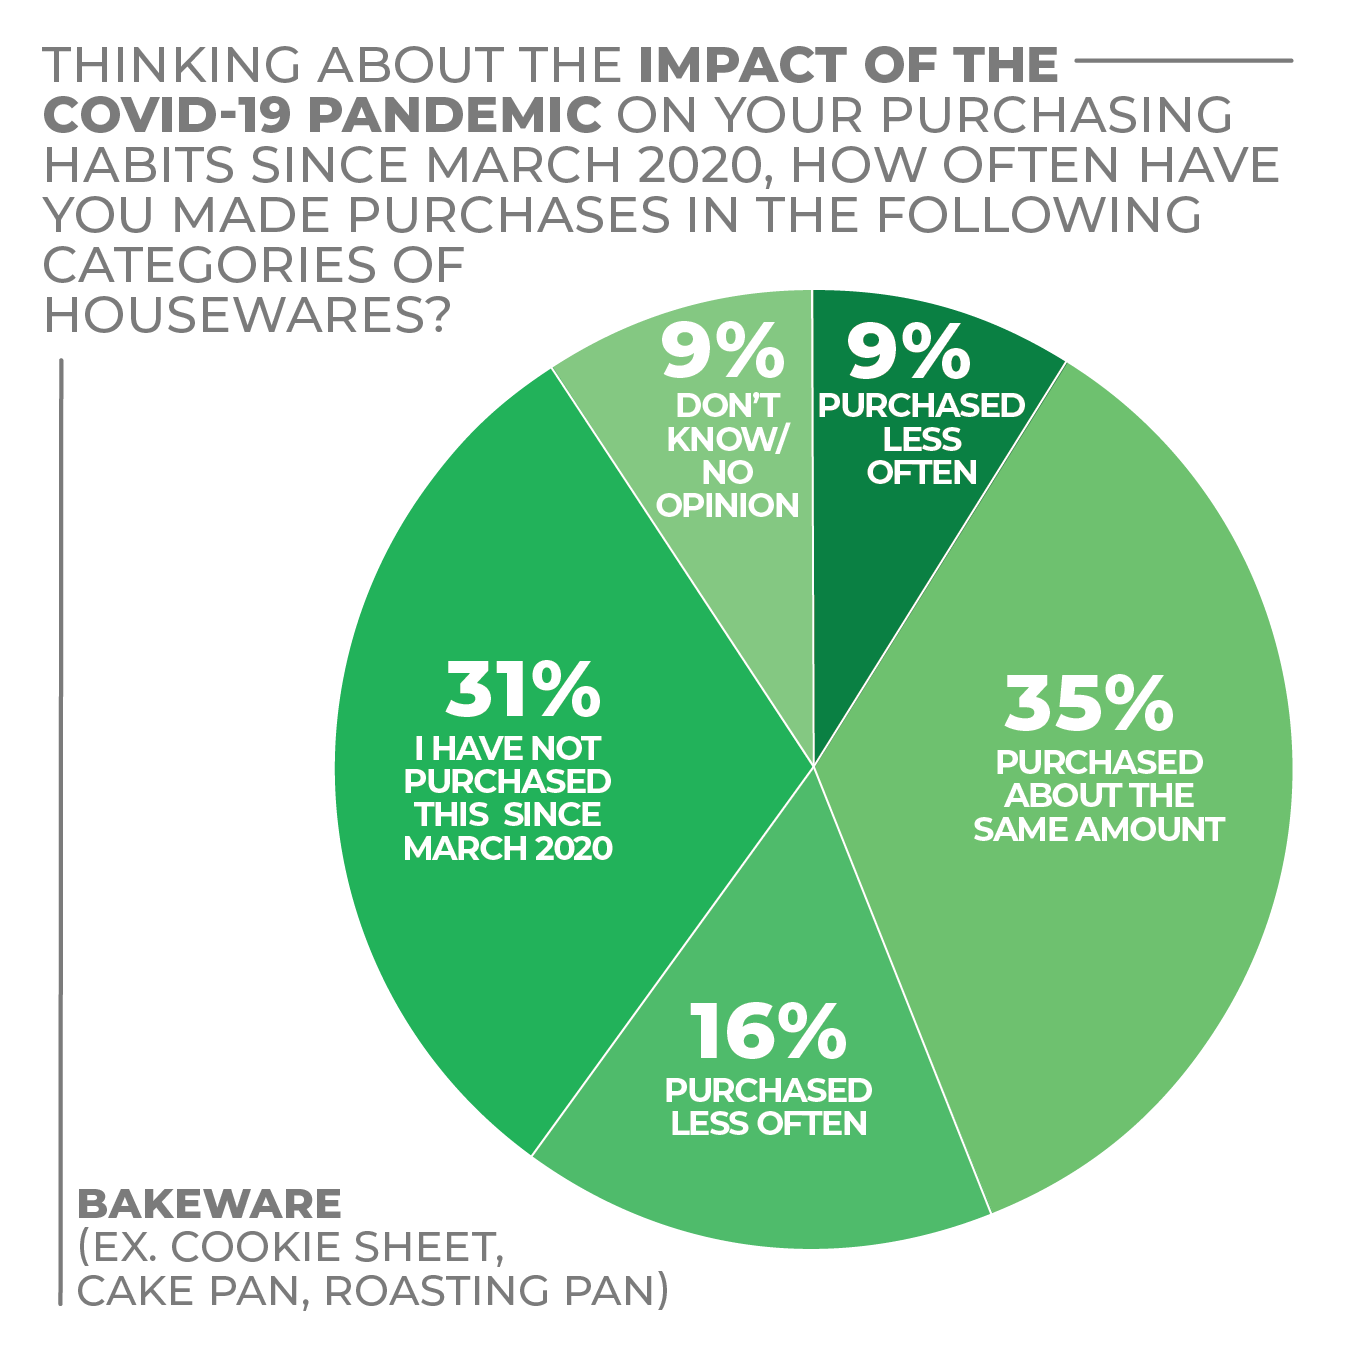
- Since March 2020, 35% of respondents stated they purchased bakeware, while 31% stated they have not purchased any since the start of the pandemic.
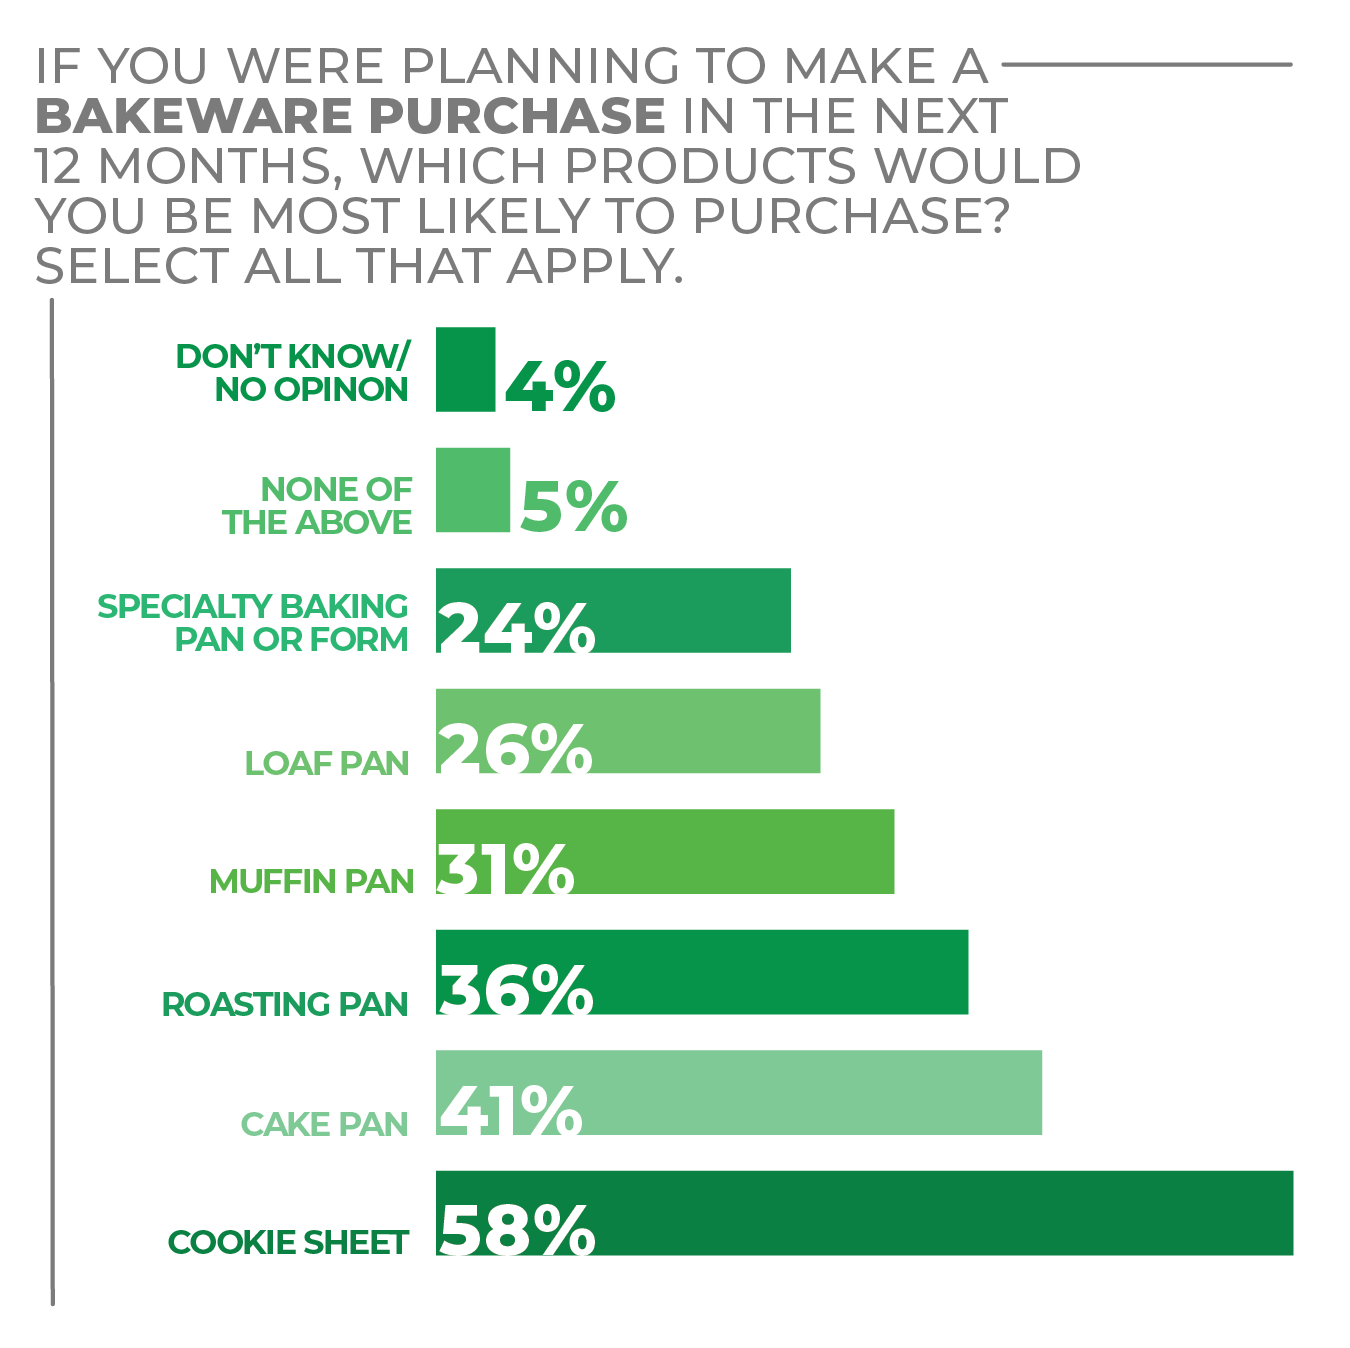
- Respondents stated they were most likely to purchase the following bakeware pieces in the coming year: Cookie Sheet (58%), Cake Pan (41%) and Roasting Pan (36%), respectively.
More Bakeware Findings:
Click on charts to enlarge.

Cleaning Tools
Cleaning tools may be entering a replacement cycle given the amount of time that consumers have spent at home — and cleaning the home — the past two years.
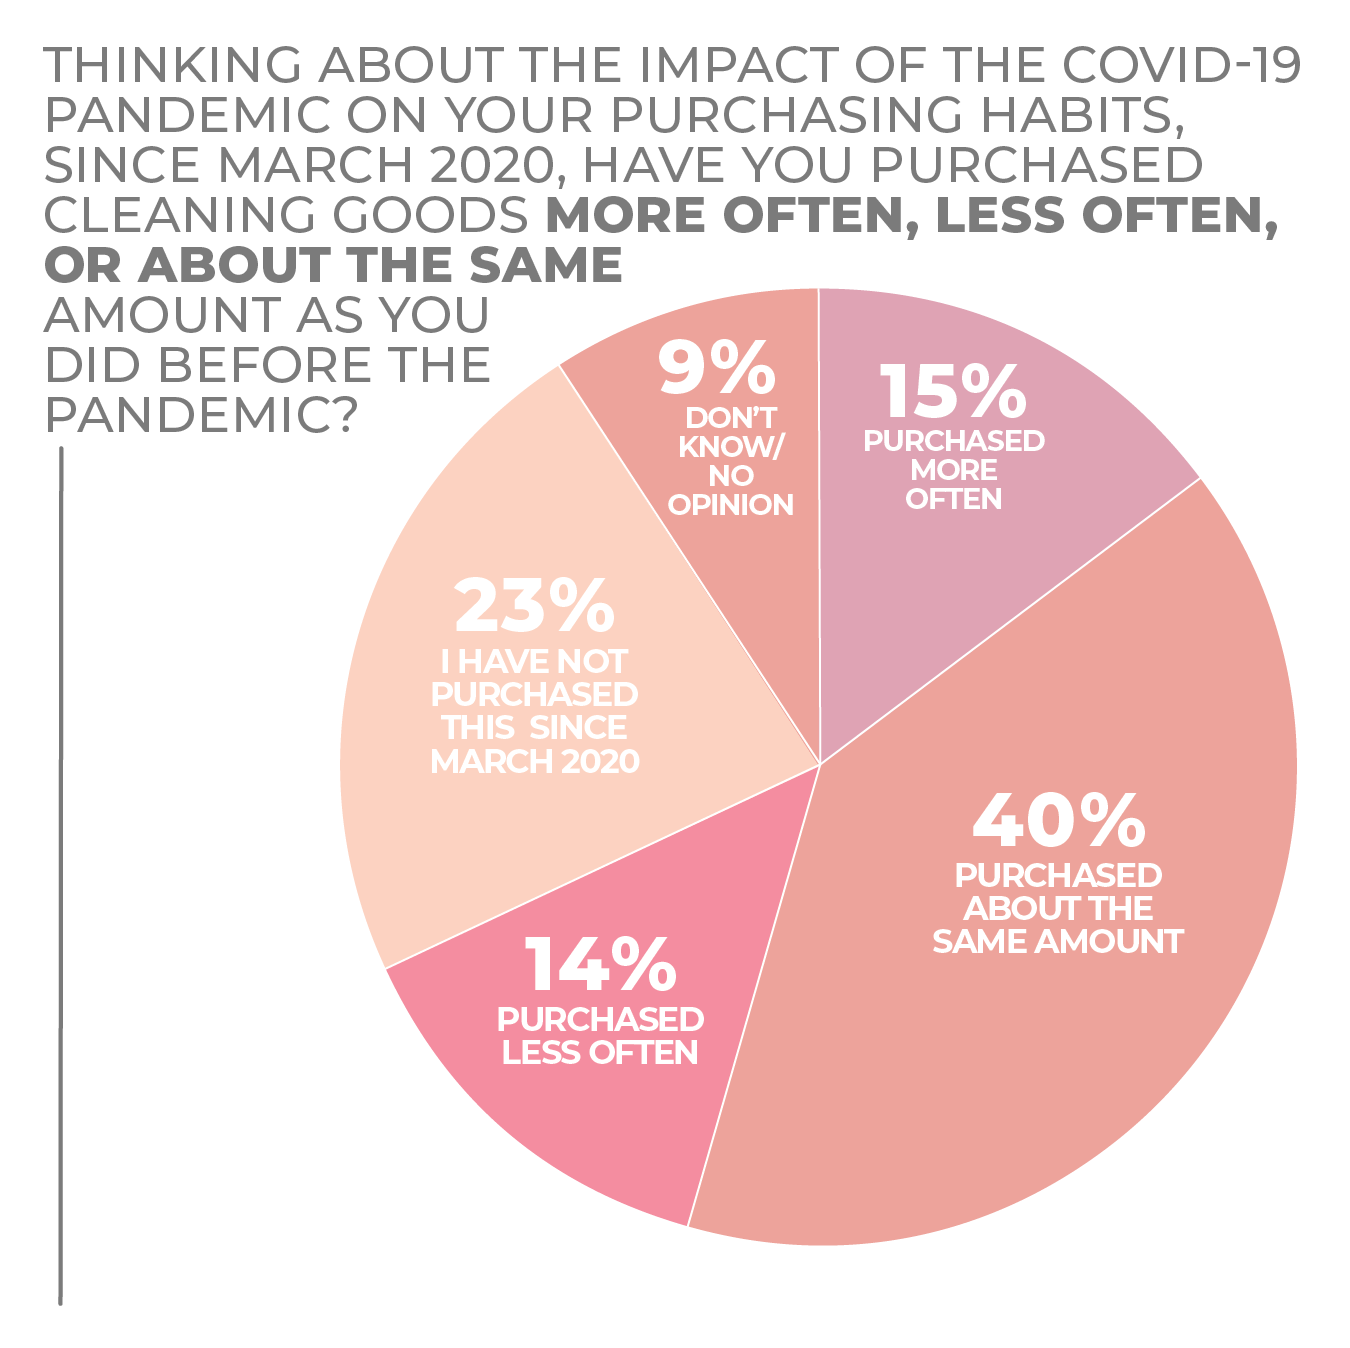
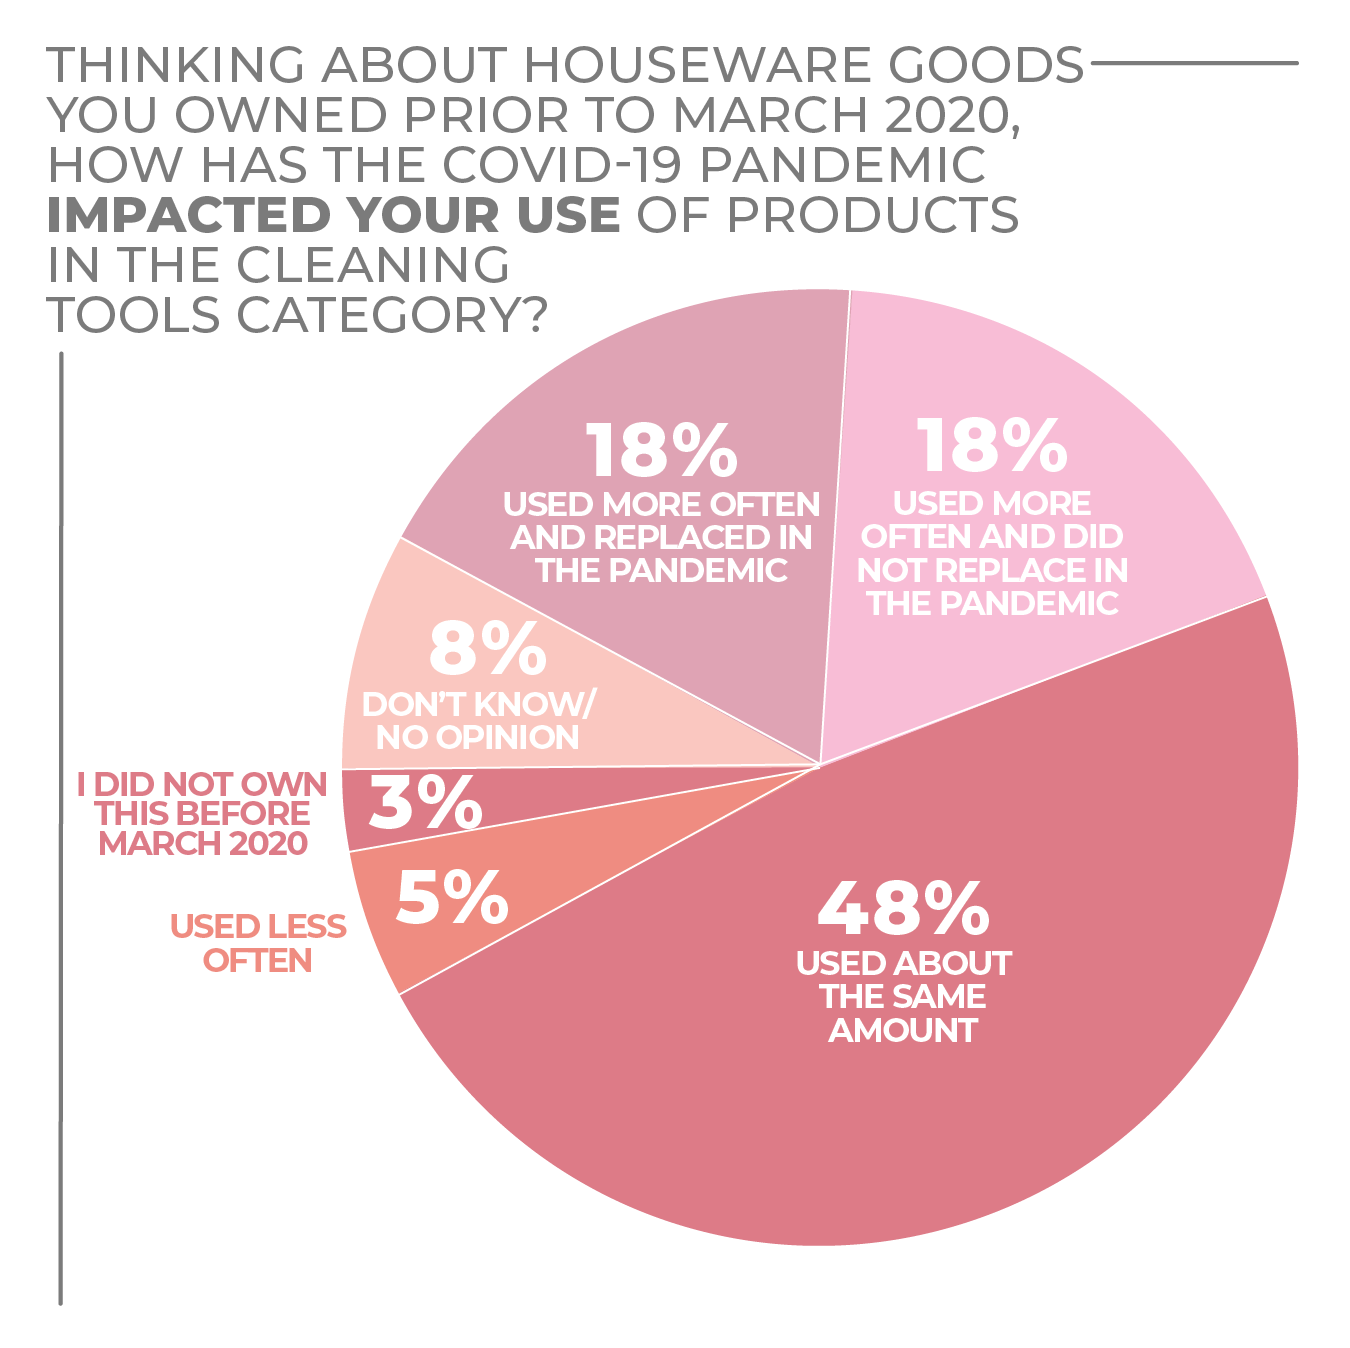
In the HomePage News 2022 Consumer Outlook Survey, only 15% of respondents said they purchased cleaning tools more often during the pandemic; 14% said they purchased less often; 40% said the same amount; and 23% said they hadn’t made a purchase at all since March 2020.
However, 36% of consumers said they had used cleaning tools more often, split evenly between those who had and had not replaced such products during the pandemic, which goes some way toward explaining soft purchasing. Only 5% of respondents said they used cleaning tools less often.
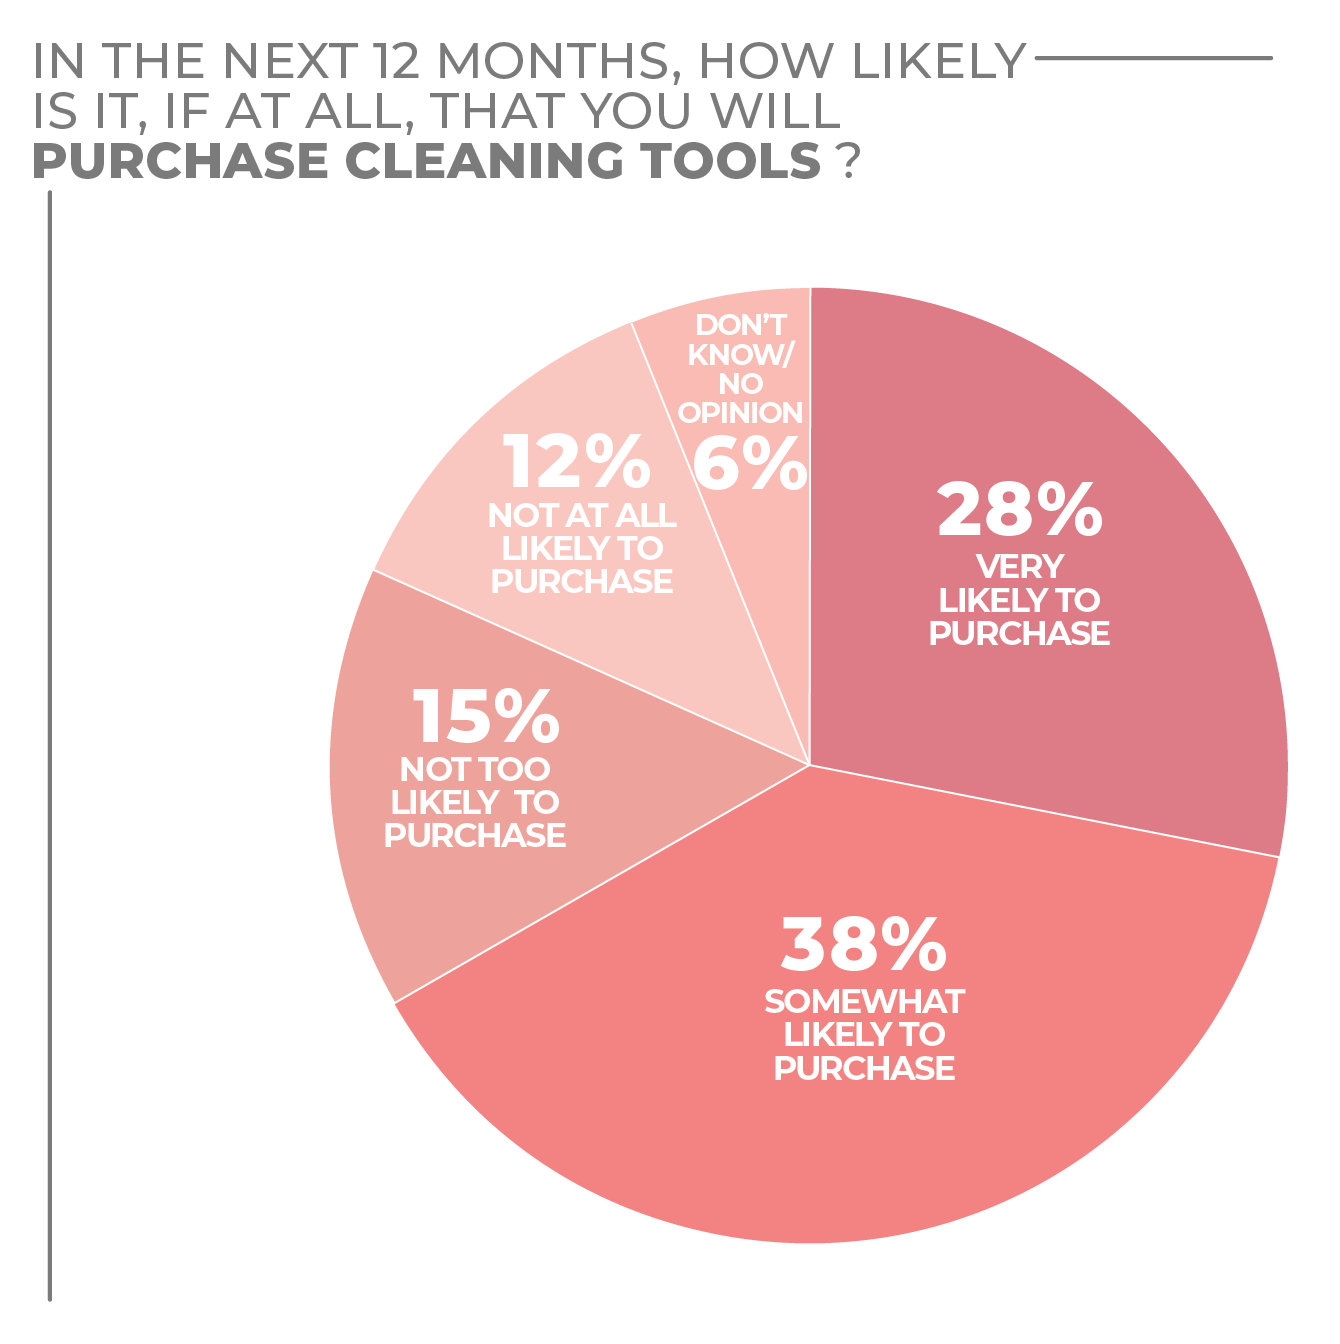
Then there’s the future. When asked if they would make a cleaning tool purchase over the next 12 months, 28% of survey respondents said they very likely would, while 38% said they were somewhat likely to do so. In combination, only 27% said they were not too likely or not at all likely to purchase cleaning tools in the period.
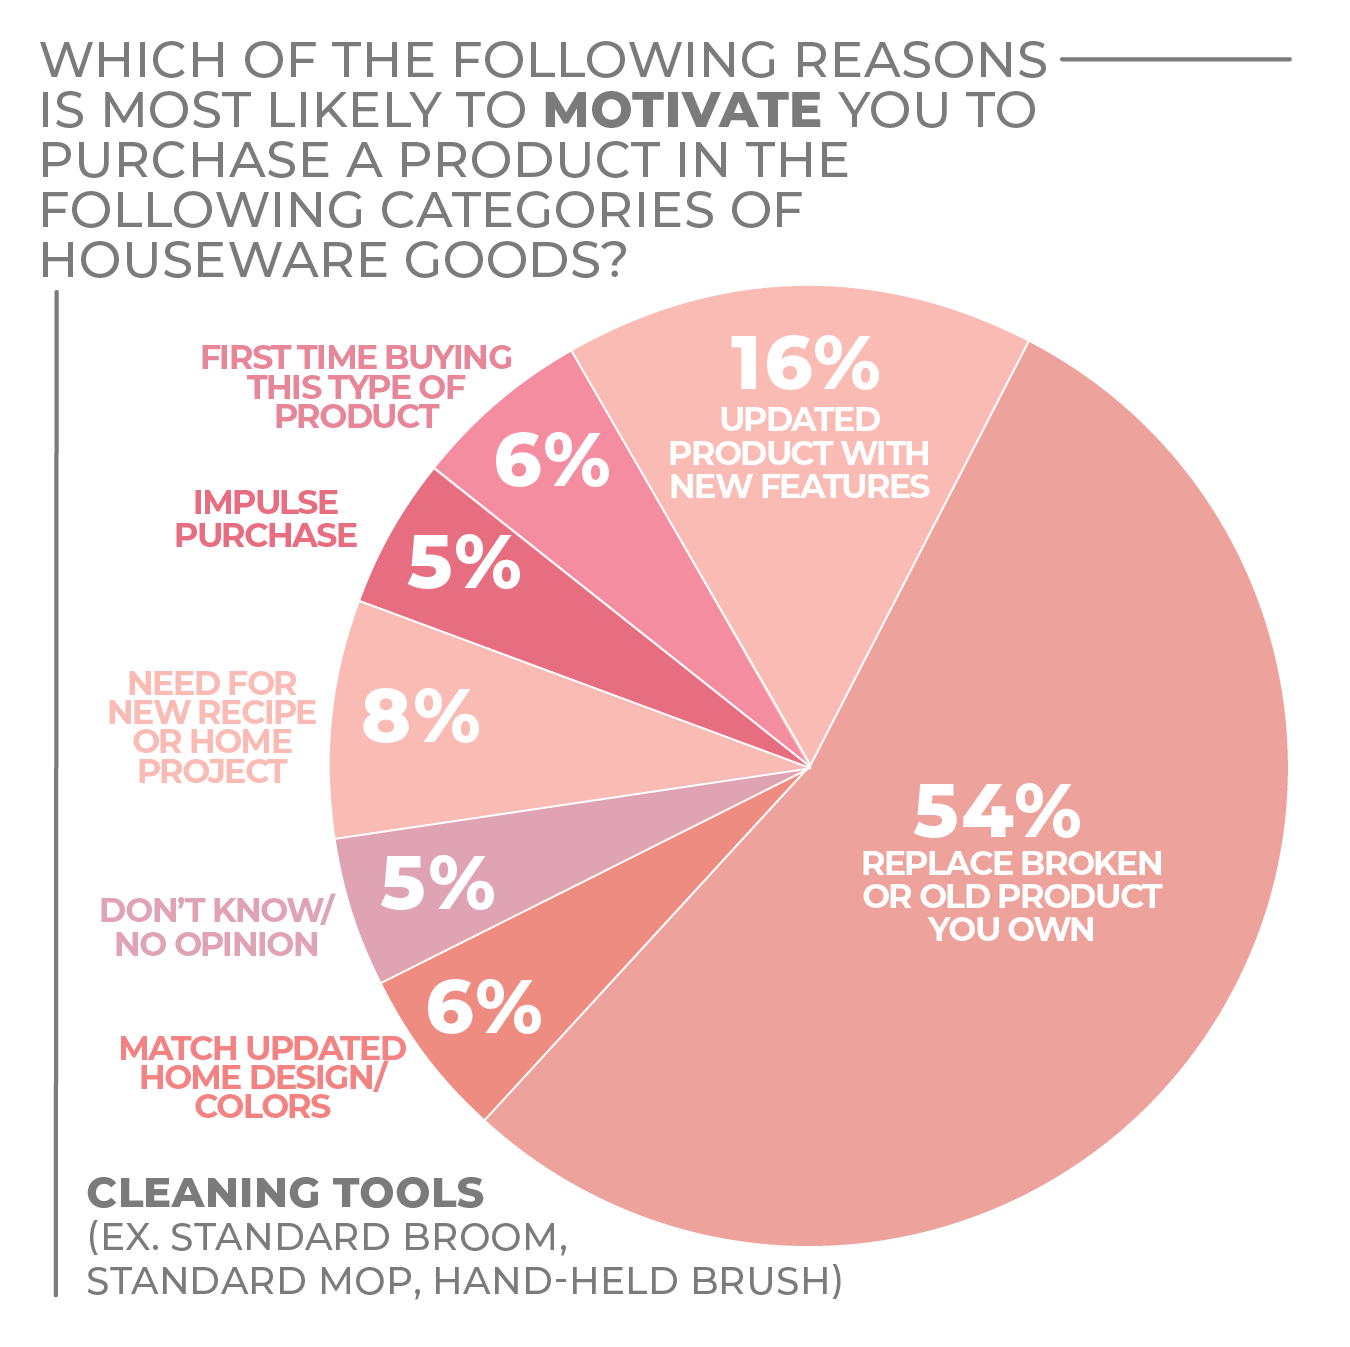
Given that just over half of consumers said the most likely reason for buying a cleaning tool is to replace a broken or old product, the numbers suggest the time has arrived for a sales spike for cleaning tools.
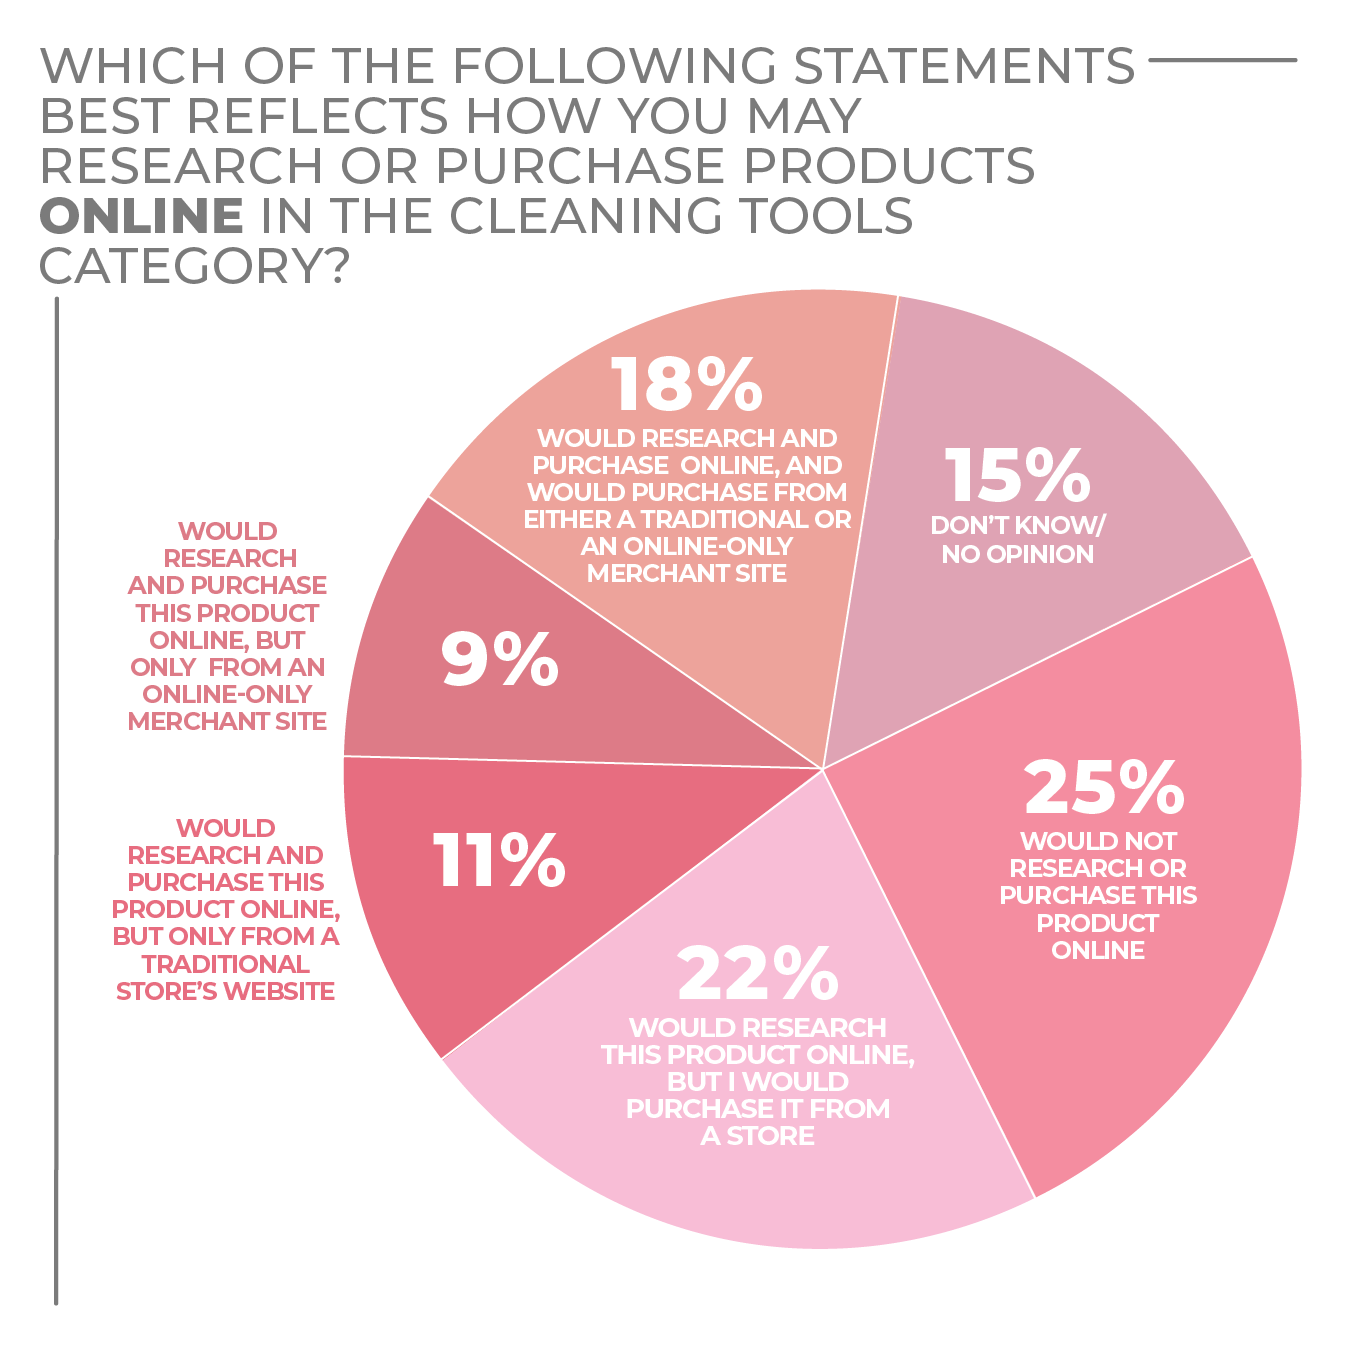
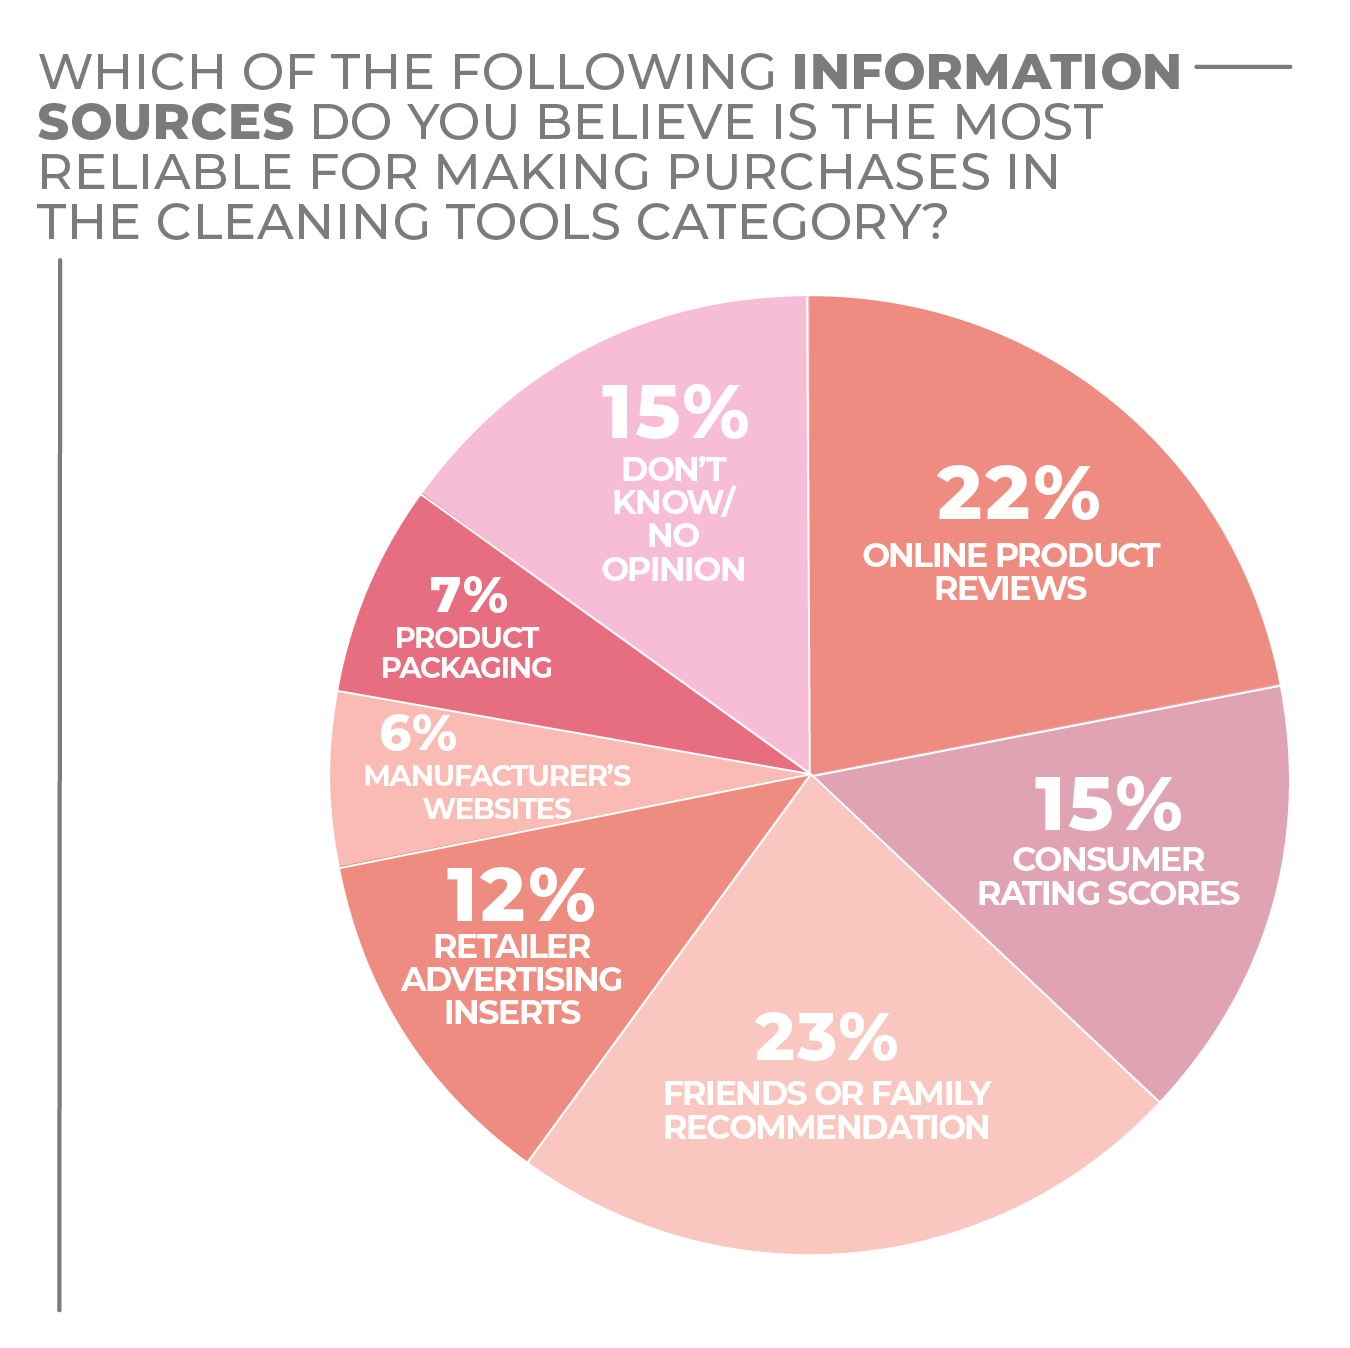
Consumers seem to be picky about where they buy their cleaning tools. When asked about how they might purchase a cleaning tool, a quarter of respondents, and the largest segment, said they would only buy in-store, and 22% said they would research online but purchase in-store. Only 9% said they would research and buy from an online-only merchant site.
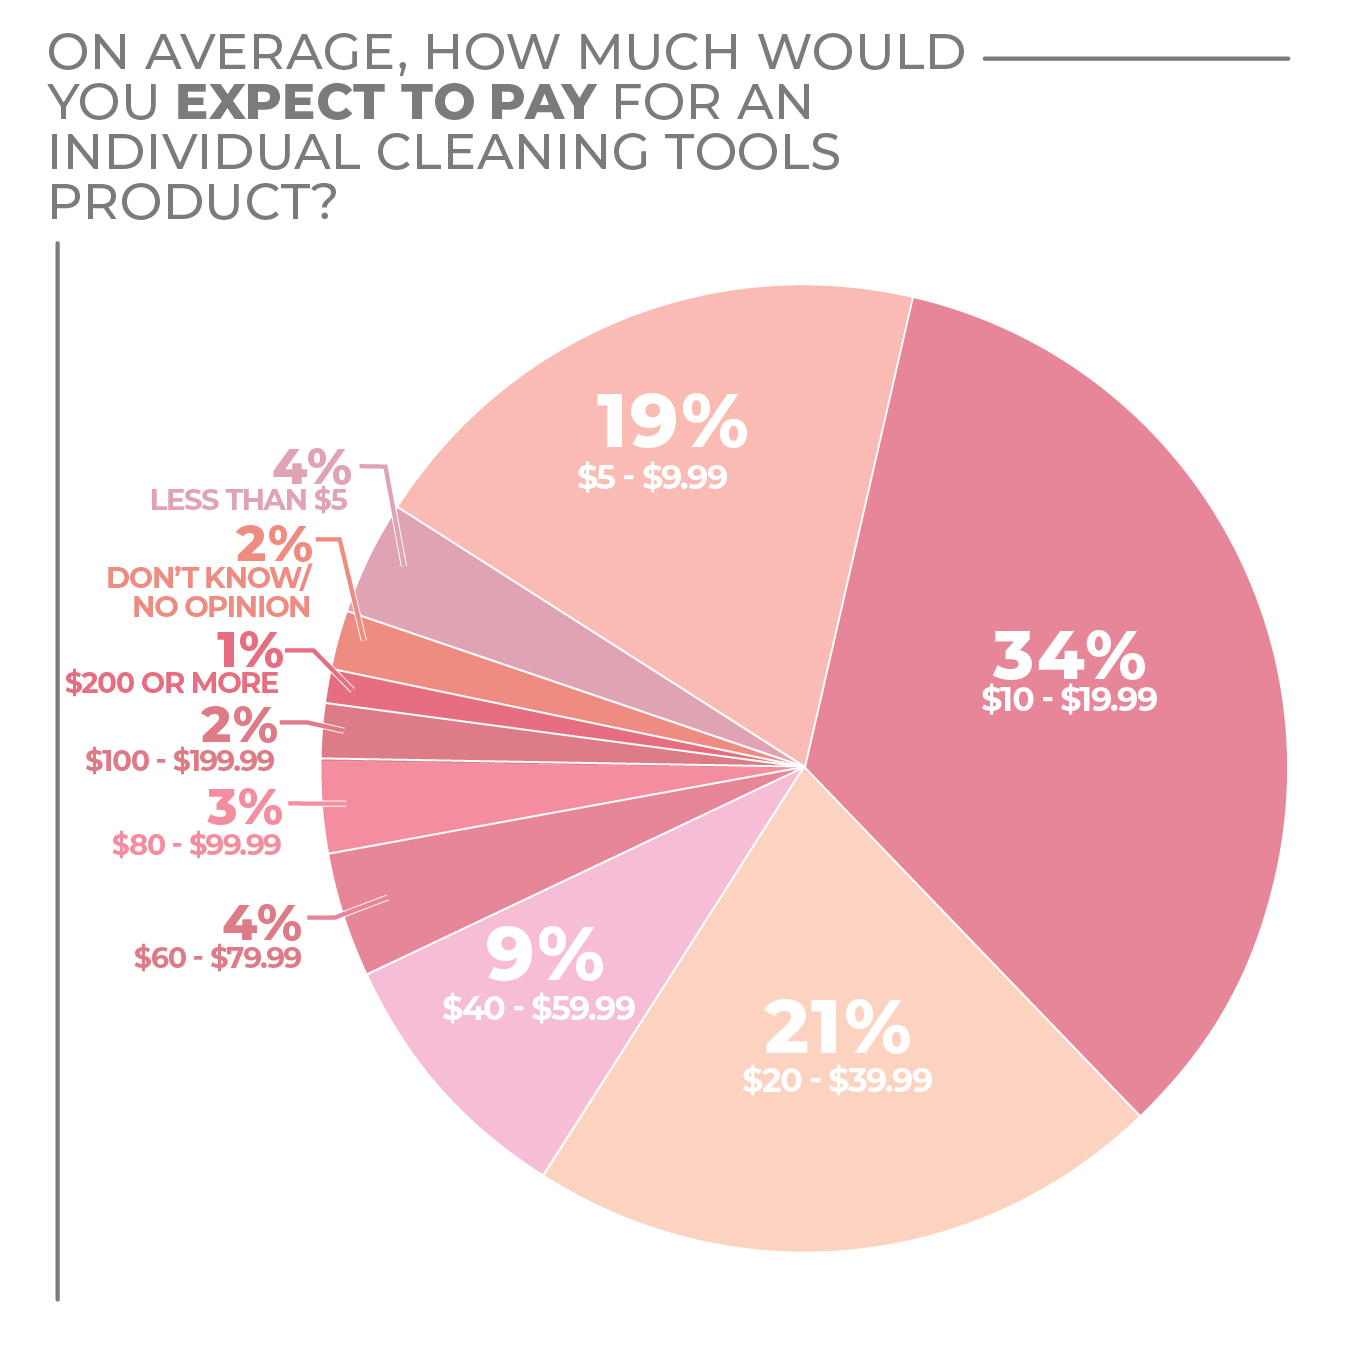
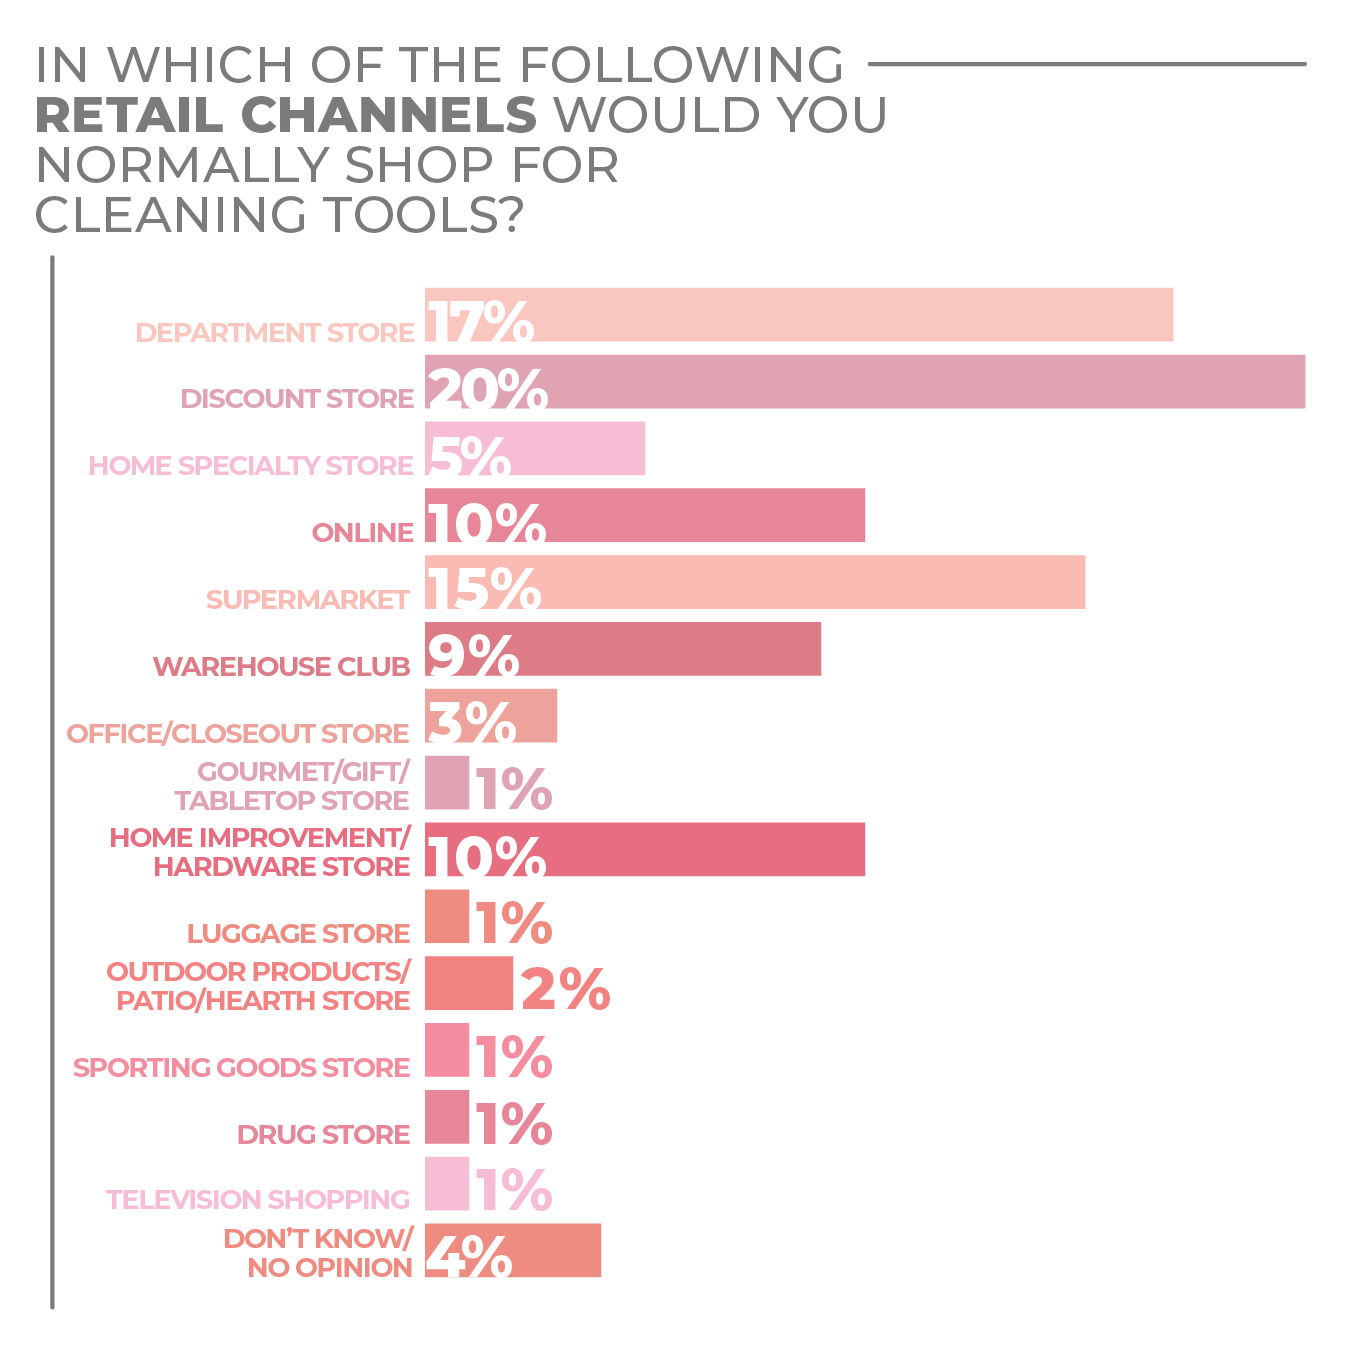
Most respondents (74%) look to purchase cleaning tools in a range from $5 to $39.99. If purchasing is focused on a narrow range of price points, consumer preference for where to purchase takes on a broad range of retailers even if they’re likely to ultimately purchase in a physical store. Discounters are the top choice at 20%, as might be expected. Four more retail channels are in double digits regarding shopping preference, and the warehouse club sector just misses at 9%.
Men may surpass women as cleaning tool purchasers in the upcoming year, as 28% of male survey respondents said they are very likely to purchase and 40% said they are somewhat likely to purchase versus 29% and 36%, respectively, of women.
Generations that are most likely buying new or second homes — millennials and Gen Xers — lead the “very likely” designation in cleaning tools purchasing at 38% and 31%, respectively. Gen Z, at 27%, isn’t far behind. Baby boomers trail at 20%.
On a regional basis, the Northeast, at 31%, is most enthusiastic about an upcoming cleaning tools purchase followed by the South, at 30%, with the Midwest and West tied at 26%. City dwellers are the ones most likely to be enthusiastic cleaning tool purchasers when the community is considered, as 24% of urban dwellers are very likely to purchase versus 14% of rural and 13% of suburban residents.
More Cleaning Tools Findings:
Click on charts to enlarge.

Cookware
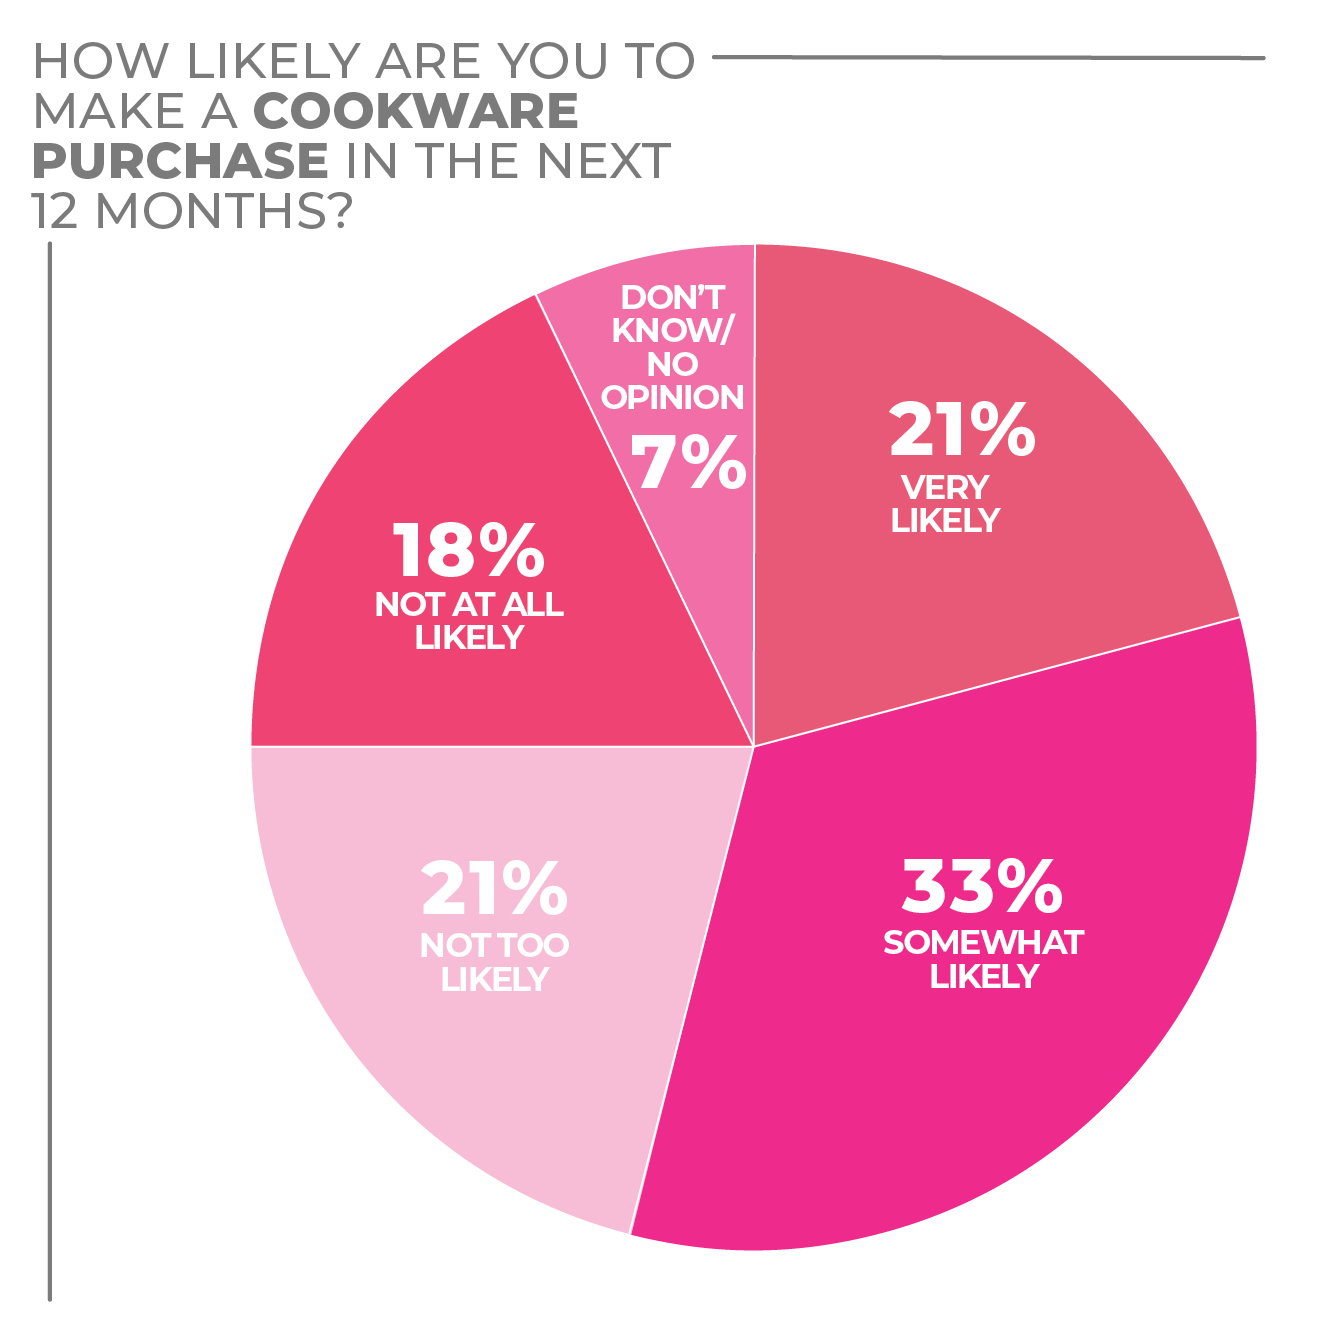
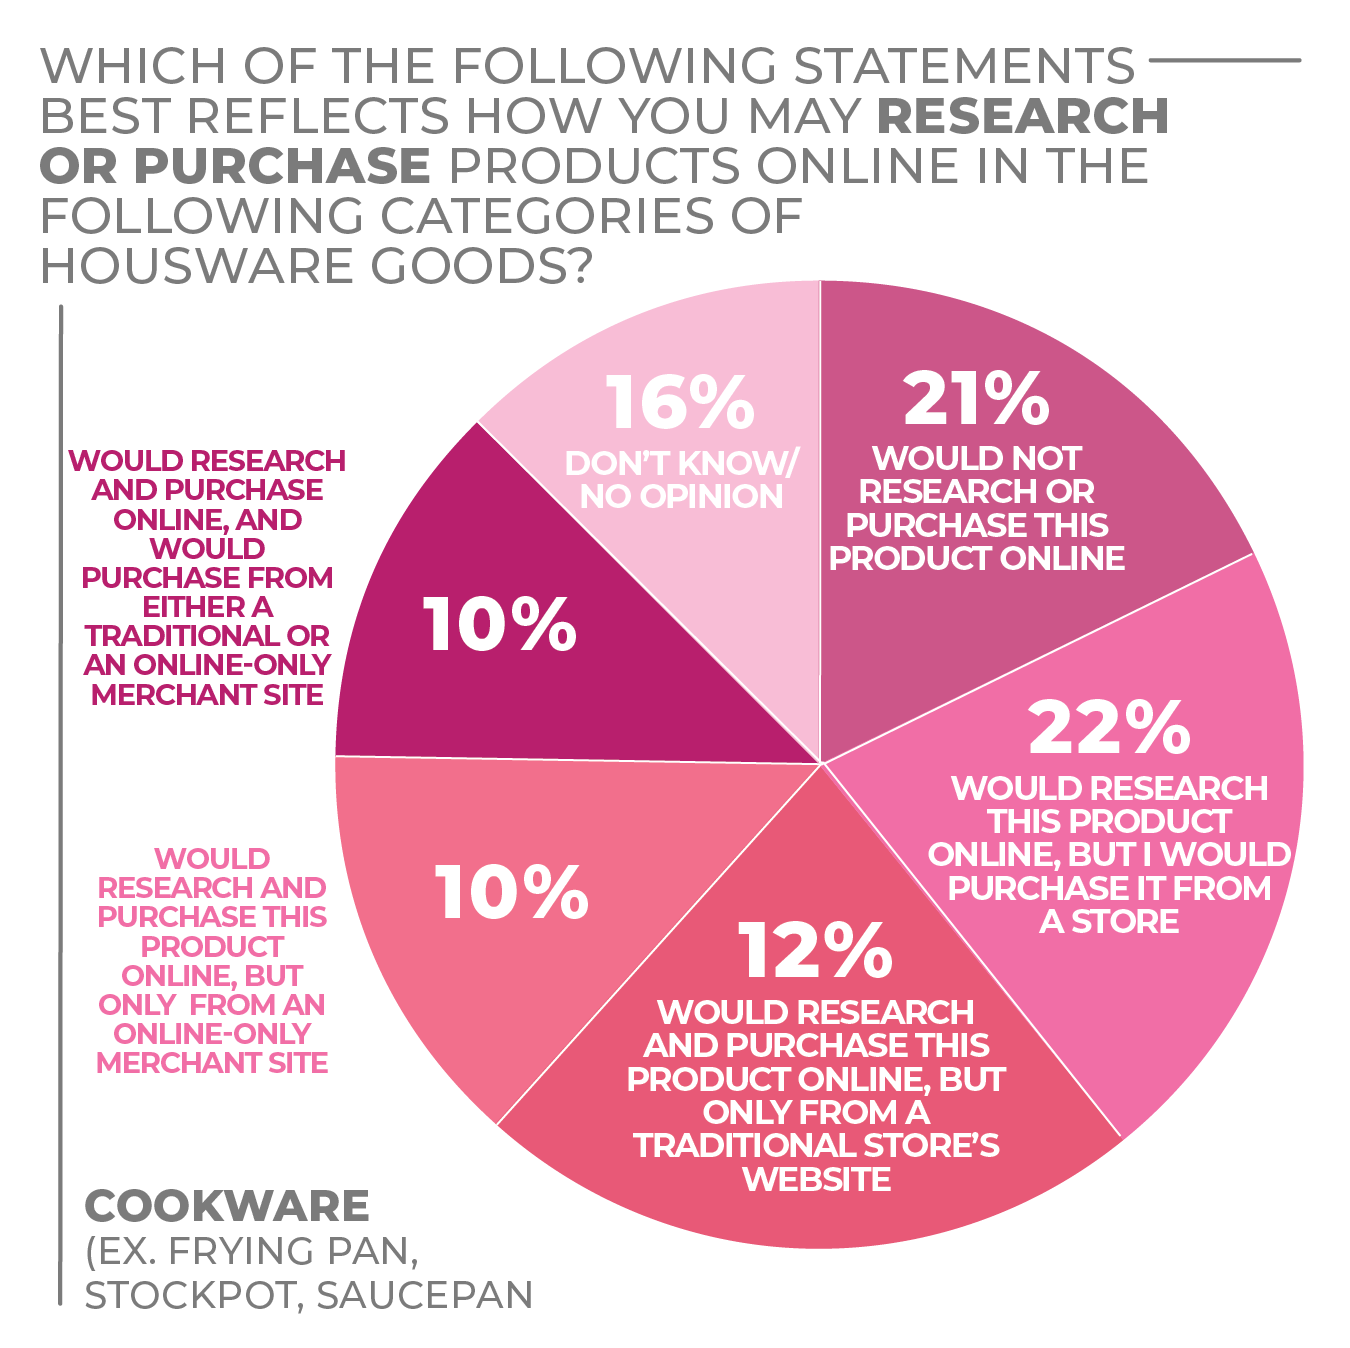
Consumers are cooking more often at home and are ready in strong numbers for new cookware purchases in 2022. According to the recent HomePage News 2022 Consumer Outlook Survey, 55% of respondents stated they were very likely or somewhat likely to make a cookware purchase in the next 12 months.
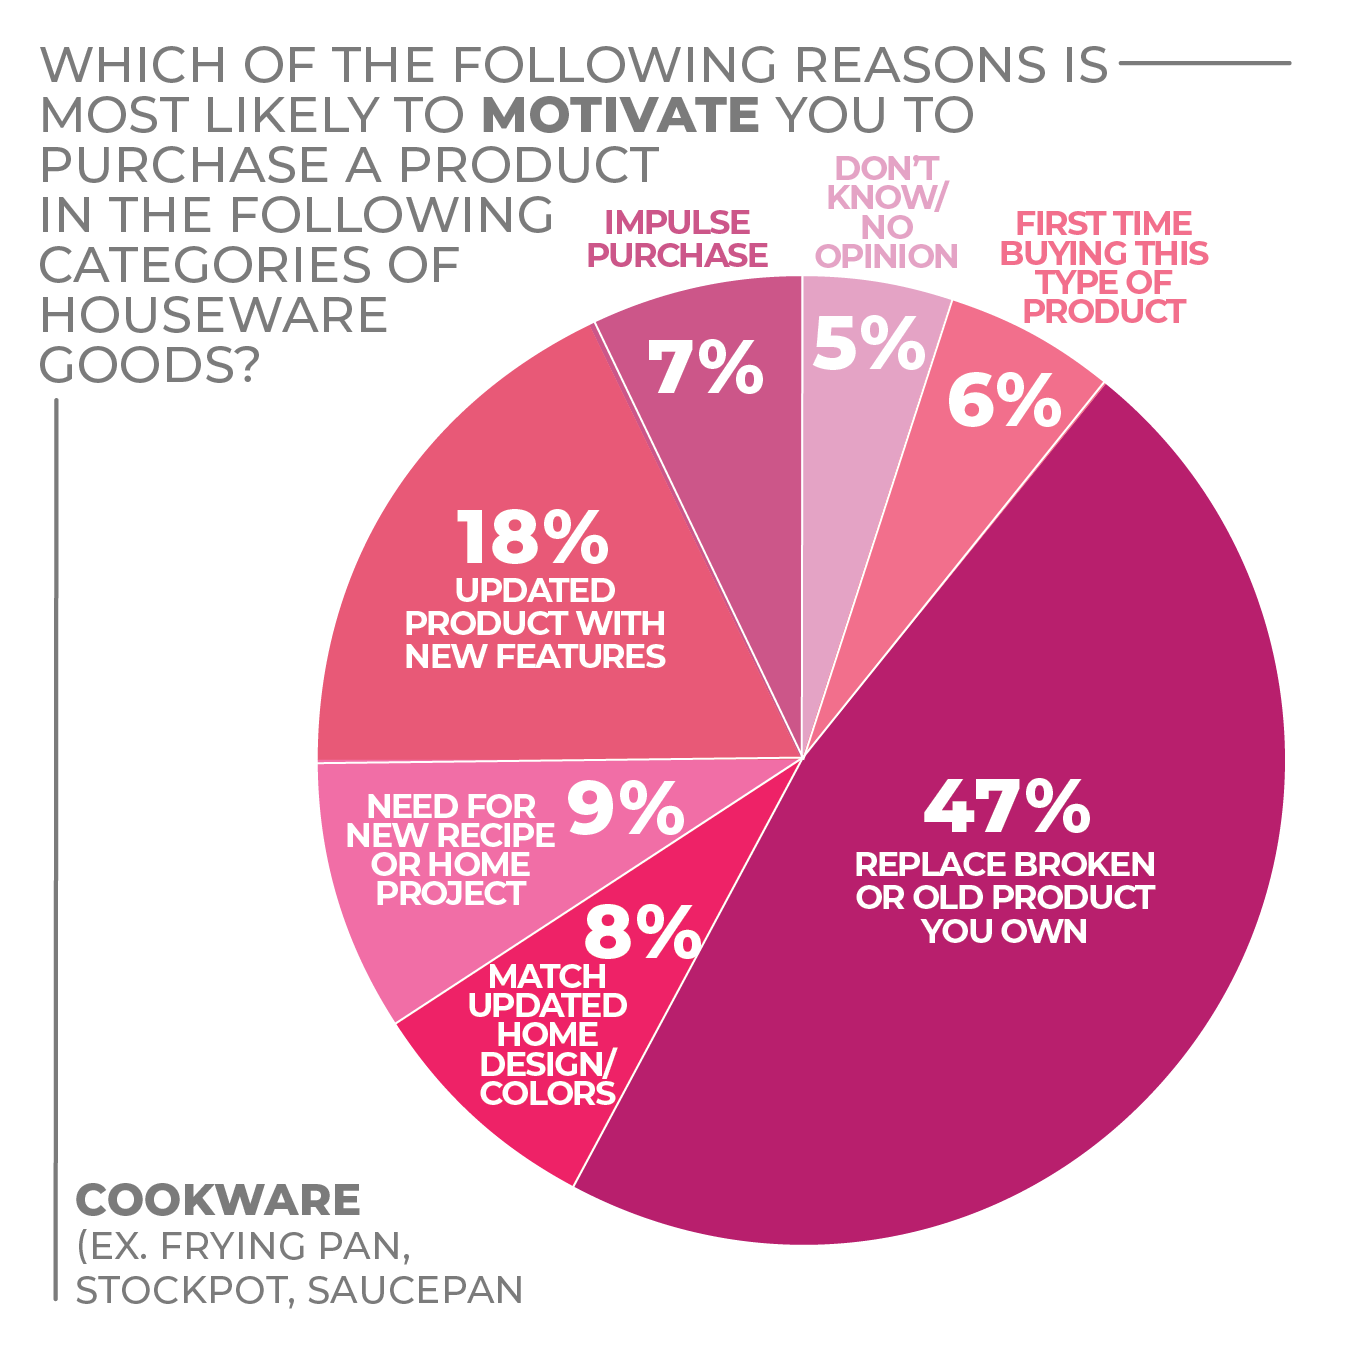
Nearly half (47%) of respondents stated they were most likely to make a purchase to replace a broken or old piece of cookware, while 18% said they would plan a purchase to upgrade to new features.
This response underscores a general consumer willingness to update their cookware collections to complement newly learned cooking techniques and skills. Cooking at home surged during the pandemic. Even prior to that, cooking was increasing in popularity among many consumers.
With the onset of social media-facilitated sharing of recipes and cooking challenges, consumers became less inhibited to try new recipes, often outside of their comfort zone. Consumer confidence in and desire for new cookware also has been stoked by popular cooking shows, marketing campaigns showcasing culinary techniques and an increase in direct-response TV and digital marketing for new entries in the category.
Also, with consumers cooking more often, sometimes three to five meals a day, their cookware is seeing much more action. That is fueling the need to replace old pieces and invest in new cookware that can offer better performance and durability.
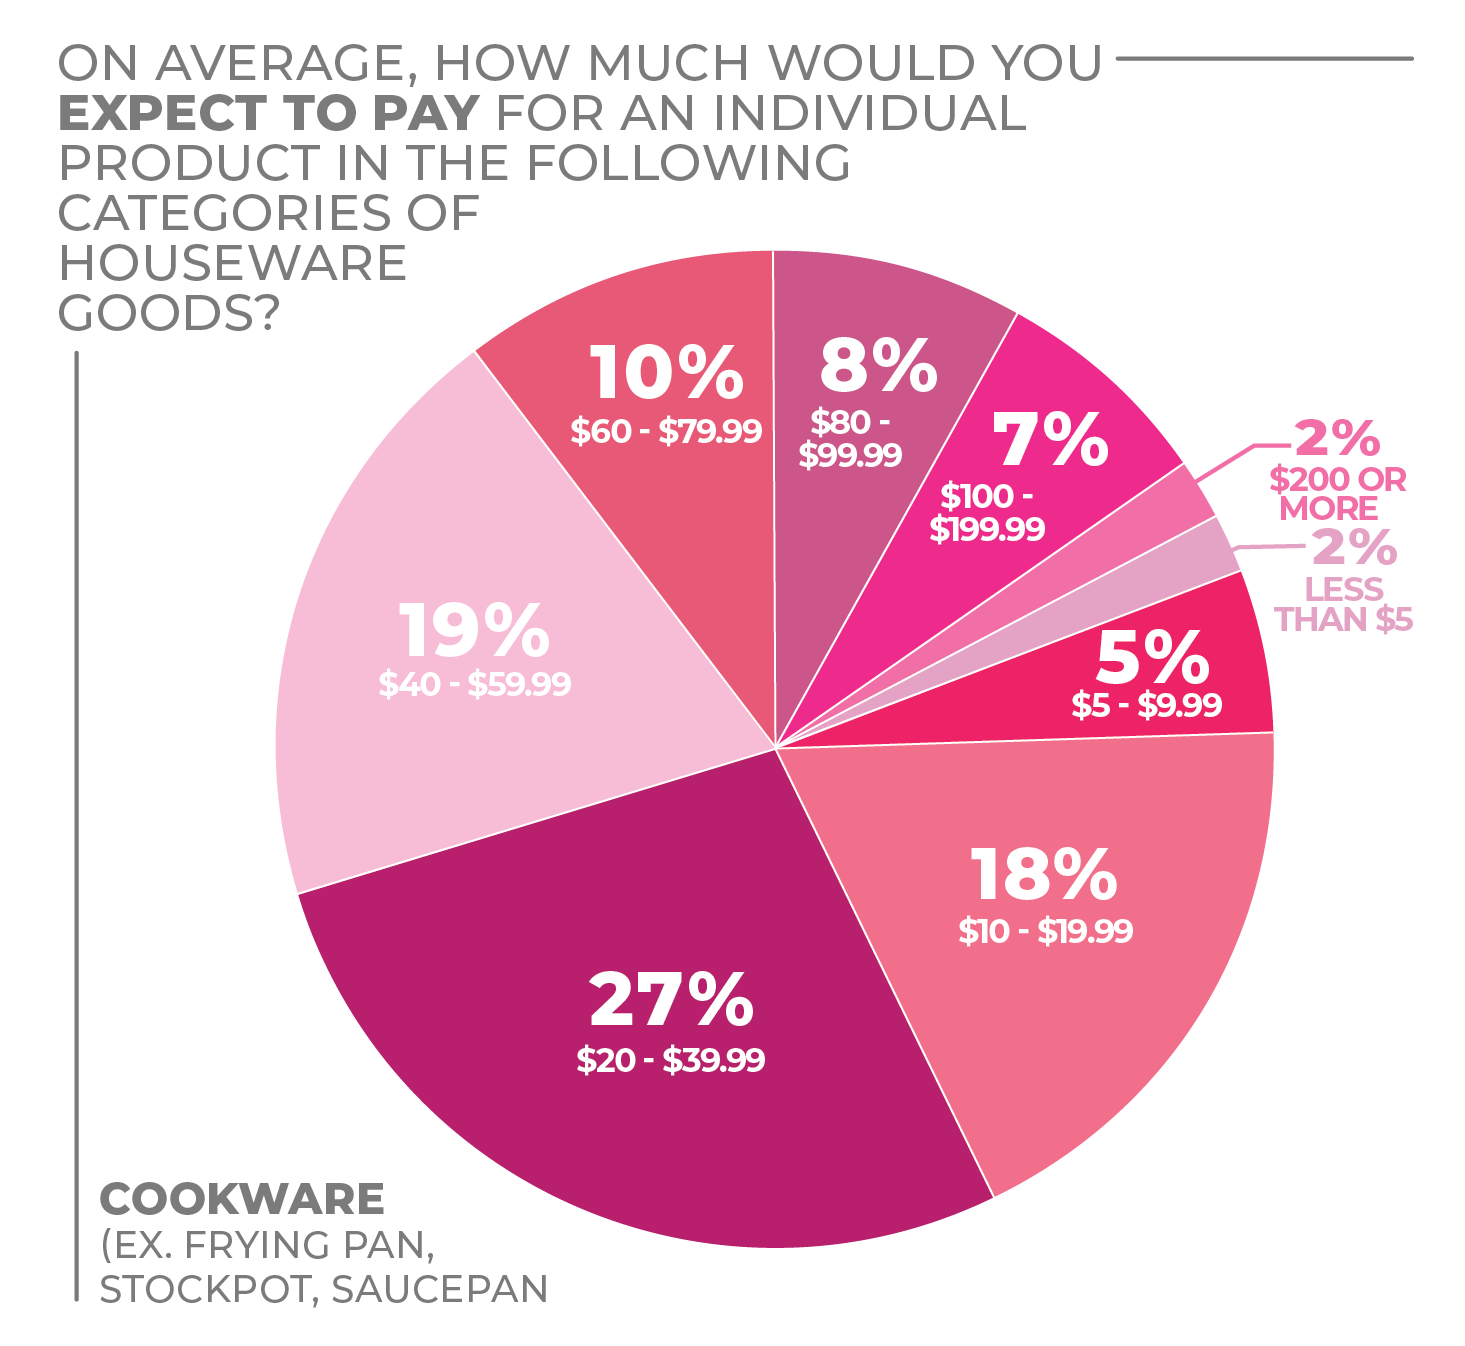
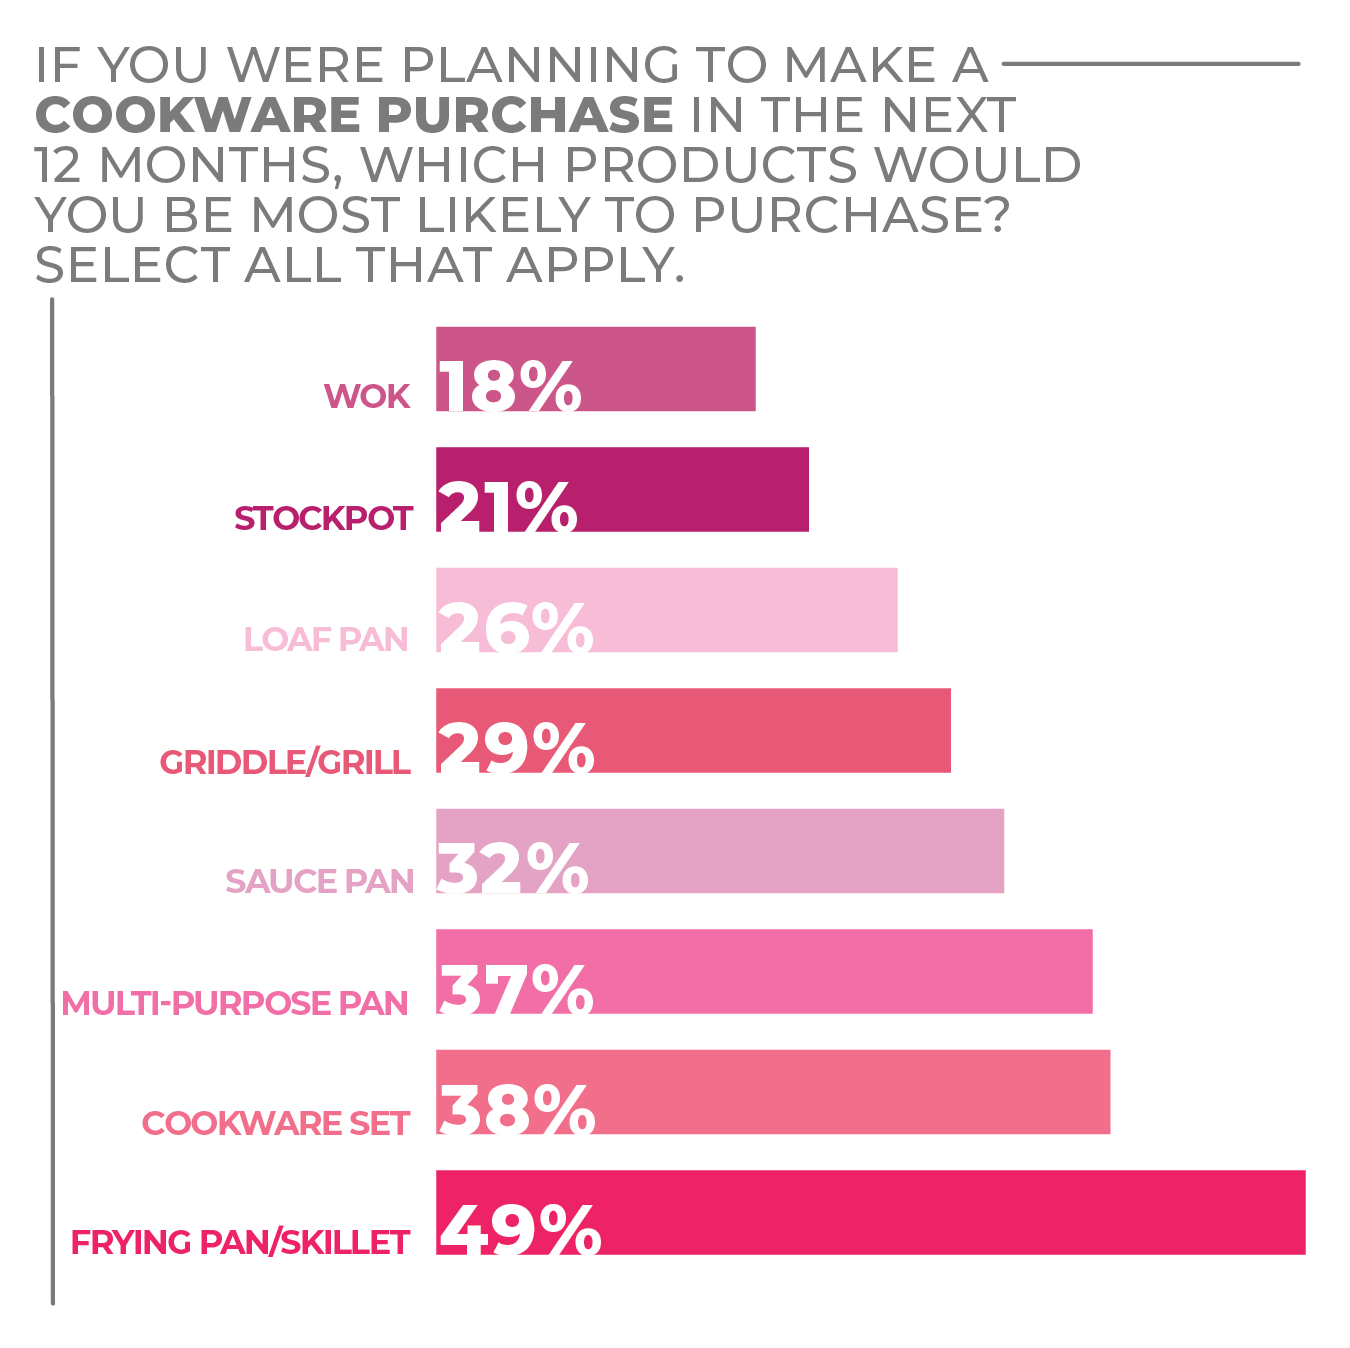
This shift is reflected in survey respondents’ price expectations in cookware. Consumers selected a range of $20 to $59.99 as their comfort zone (46%), with 10% stating they would spend between $60-$79.99 when purchasing new cookware pieces. As for what they are planning to buy, a frying pan/skillet earned the most responses (49%), followed by a cookware set (38%) and a multi-purpose pan (37%).
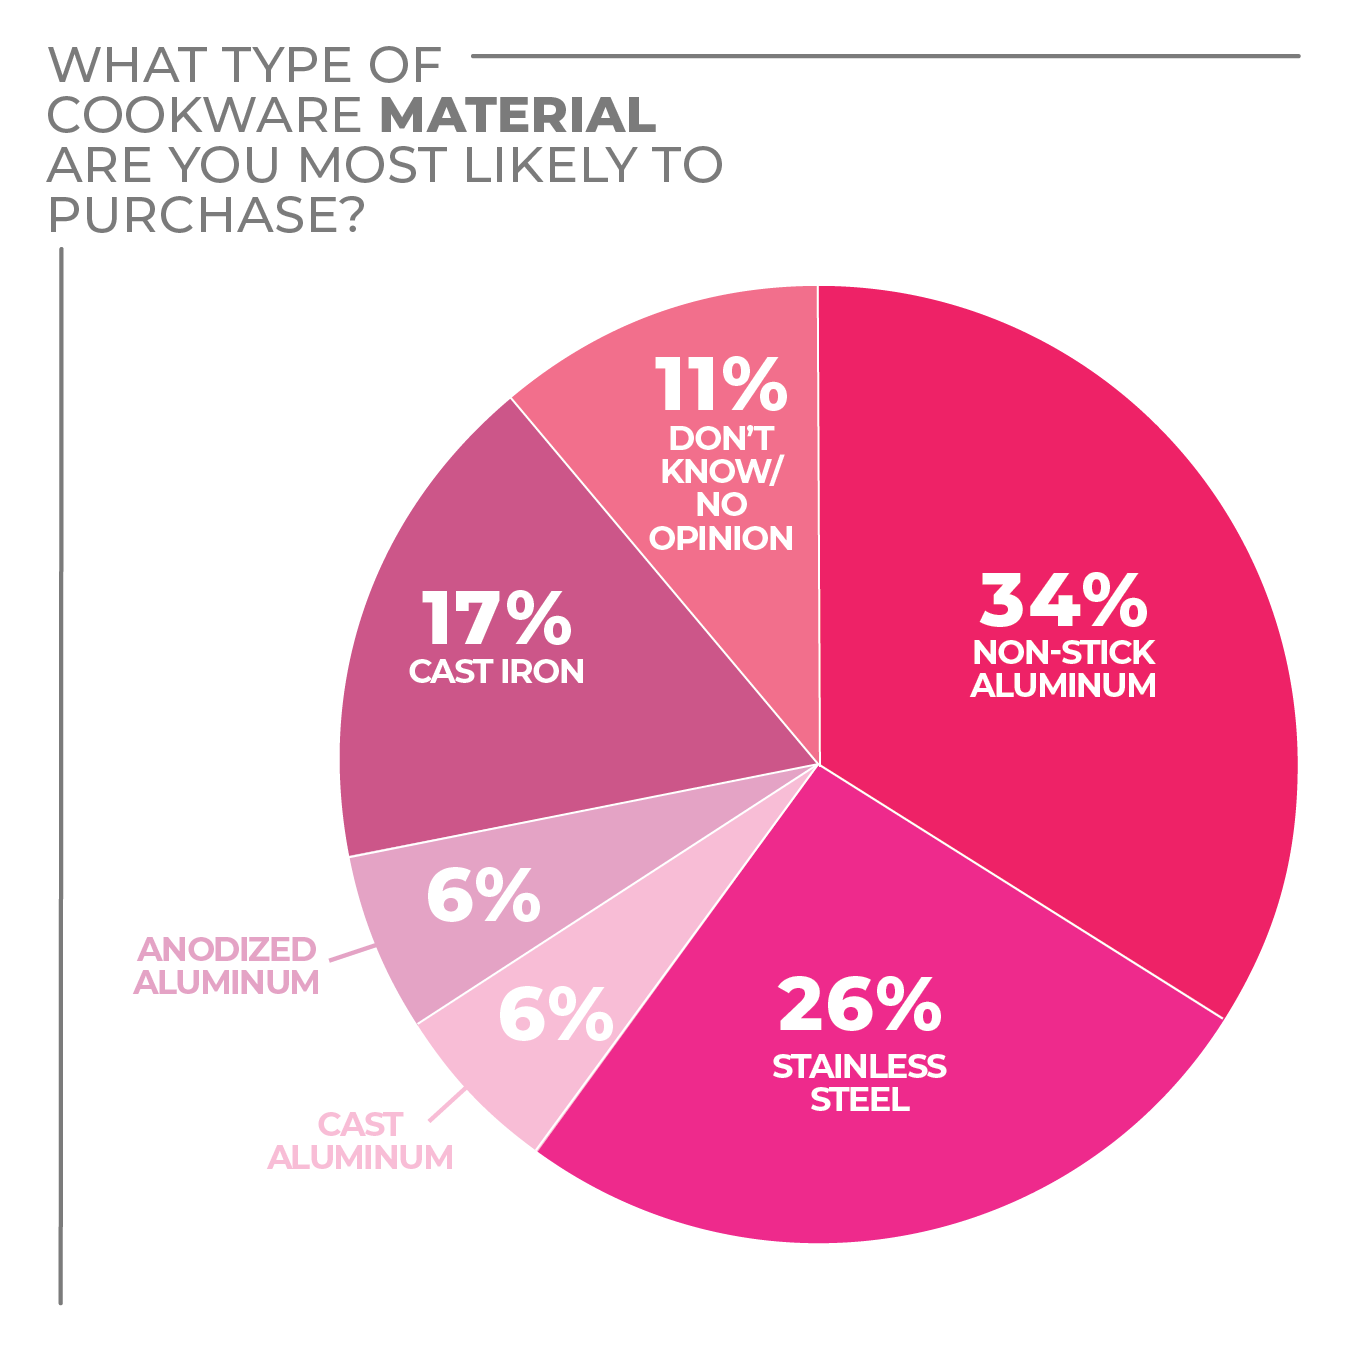
When it comes to the materials consumers prefer for their cookware, non-stick aluminum (34%) and stainless steel (26%) lead with the most responses, with cast iron rounding out the top three with 17% of responses.
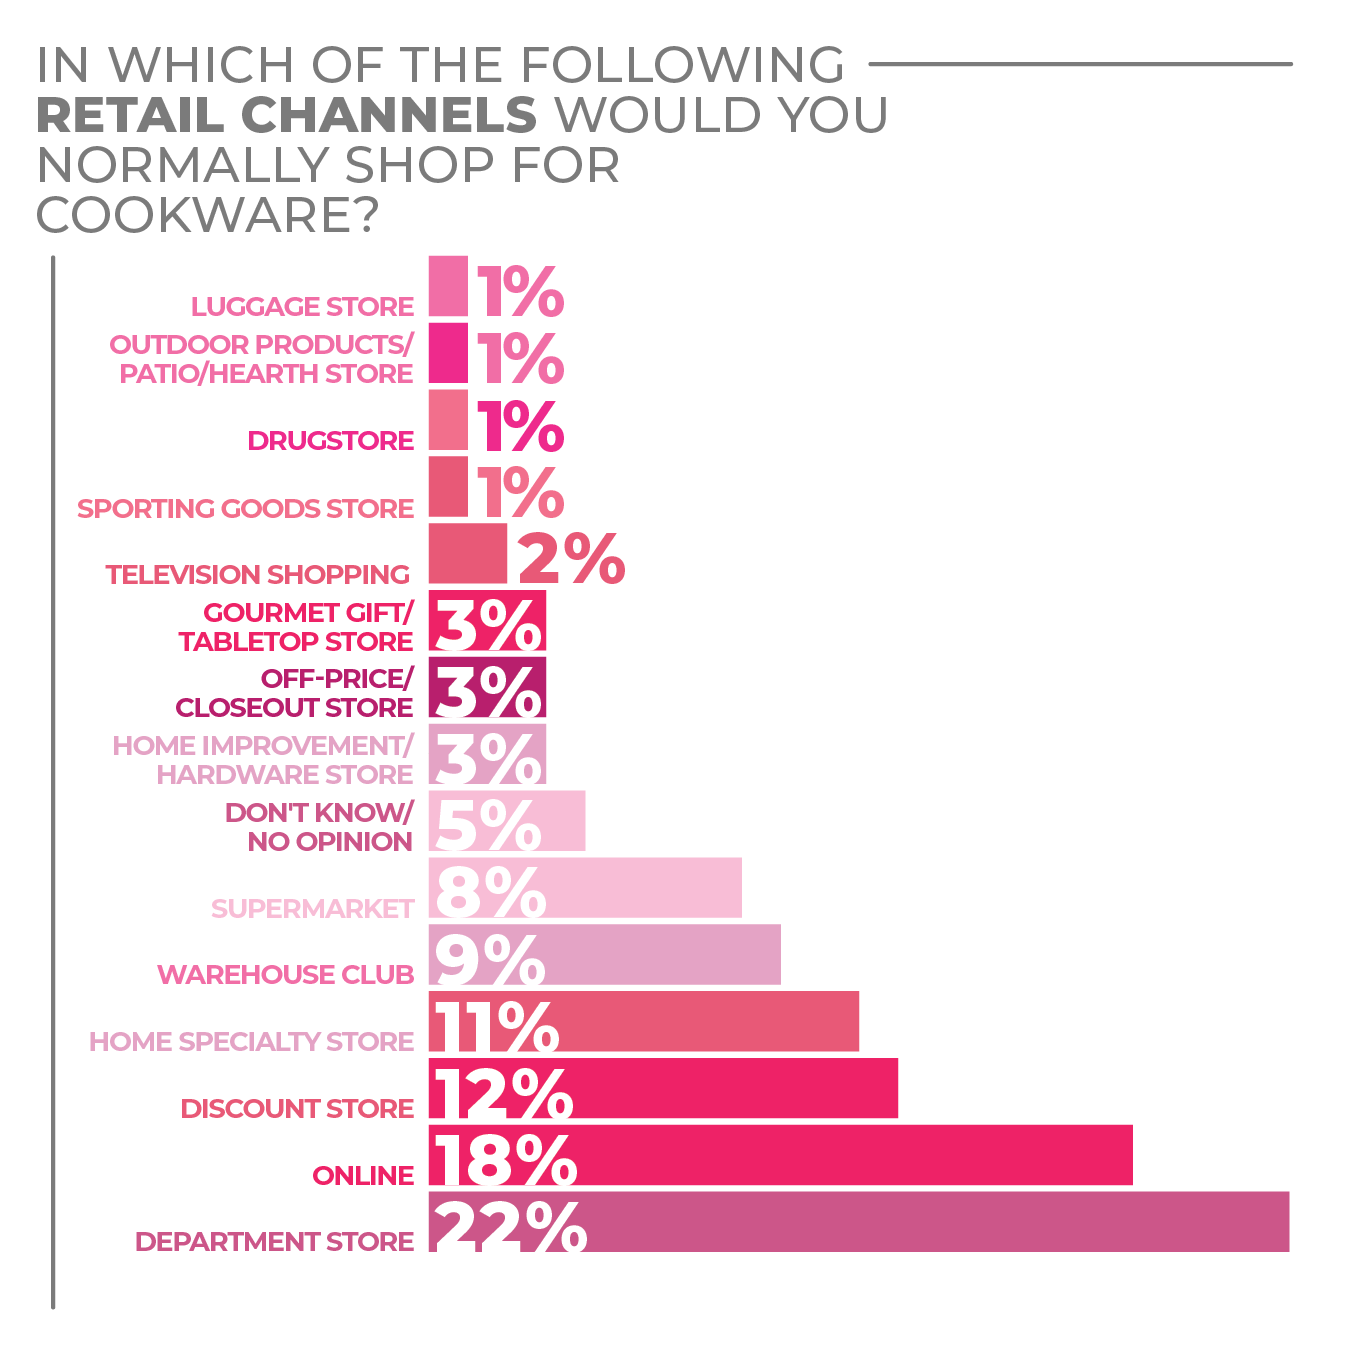
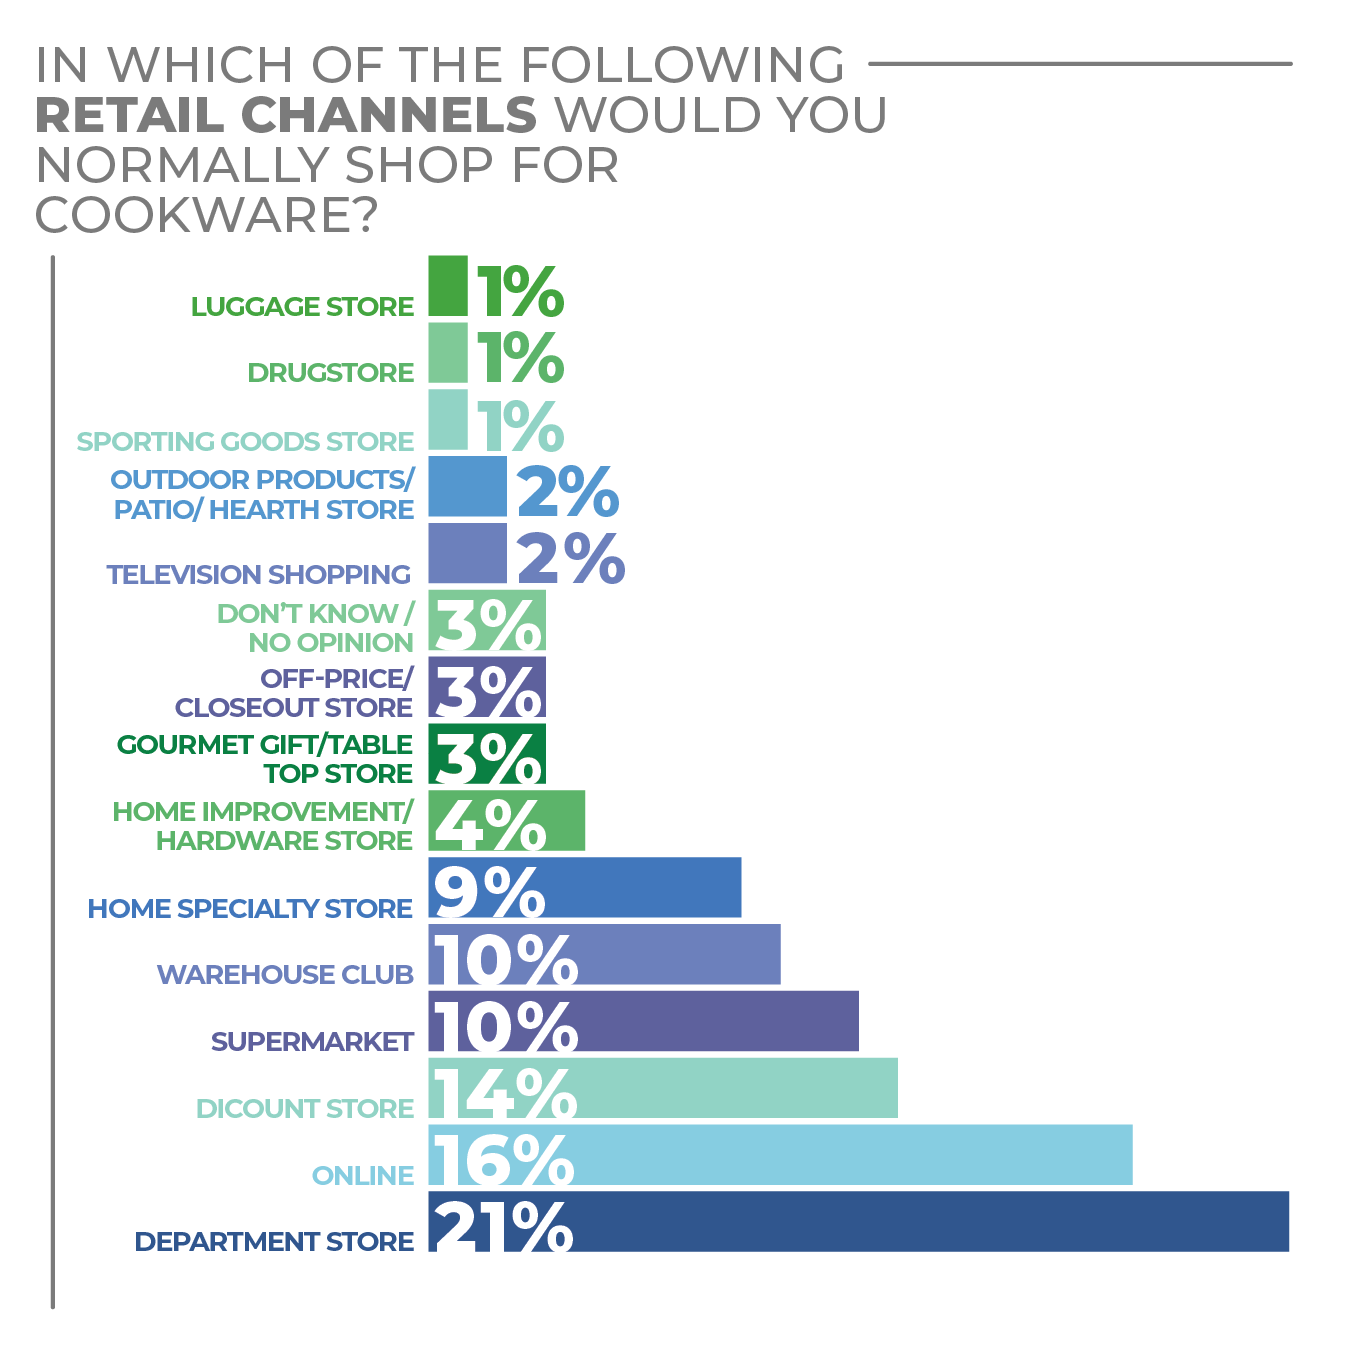
As for where consumers are making their cookware purchases, while department stores, discount stores and home specialty stores collectively scored high, online purchases were specified by 18%.
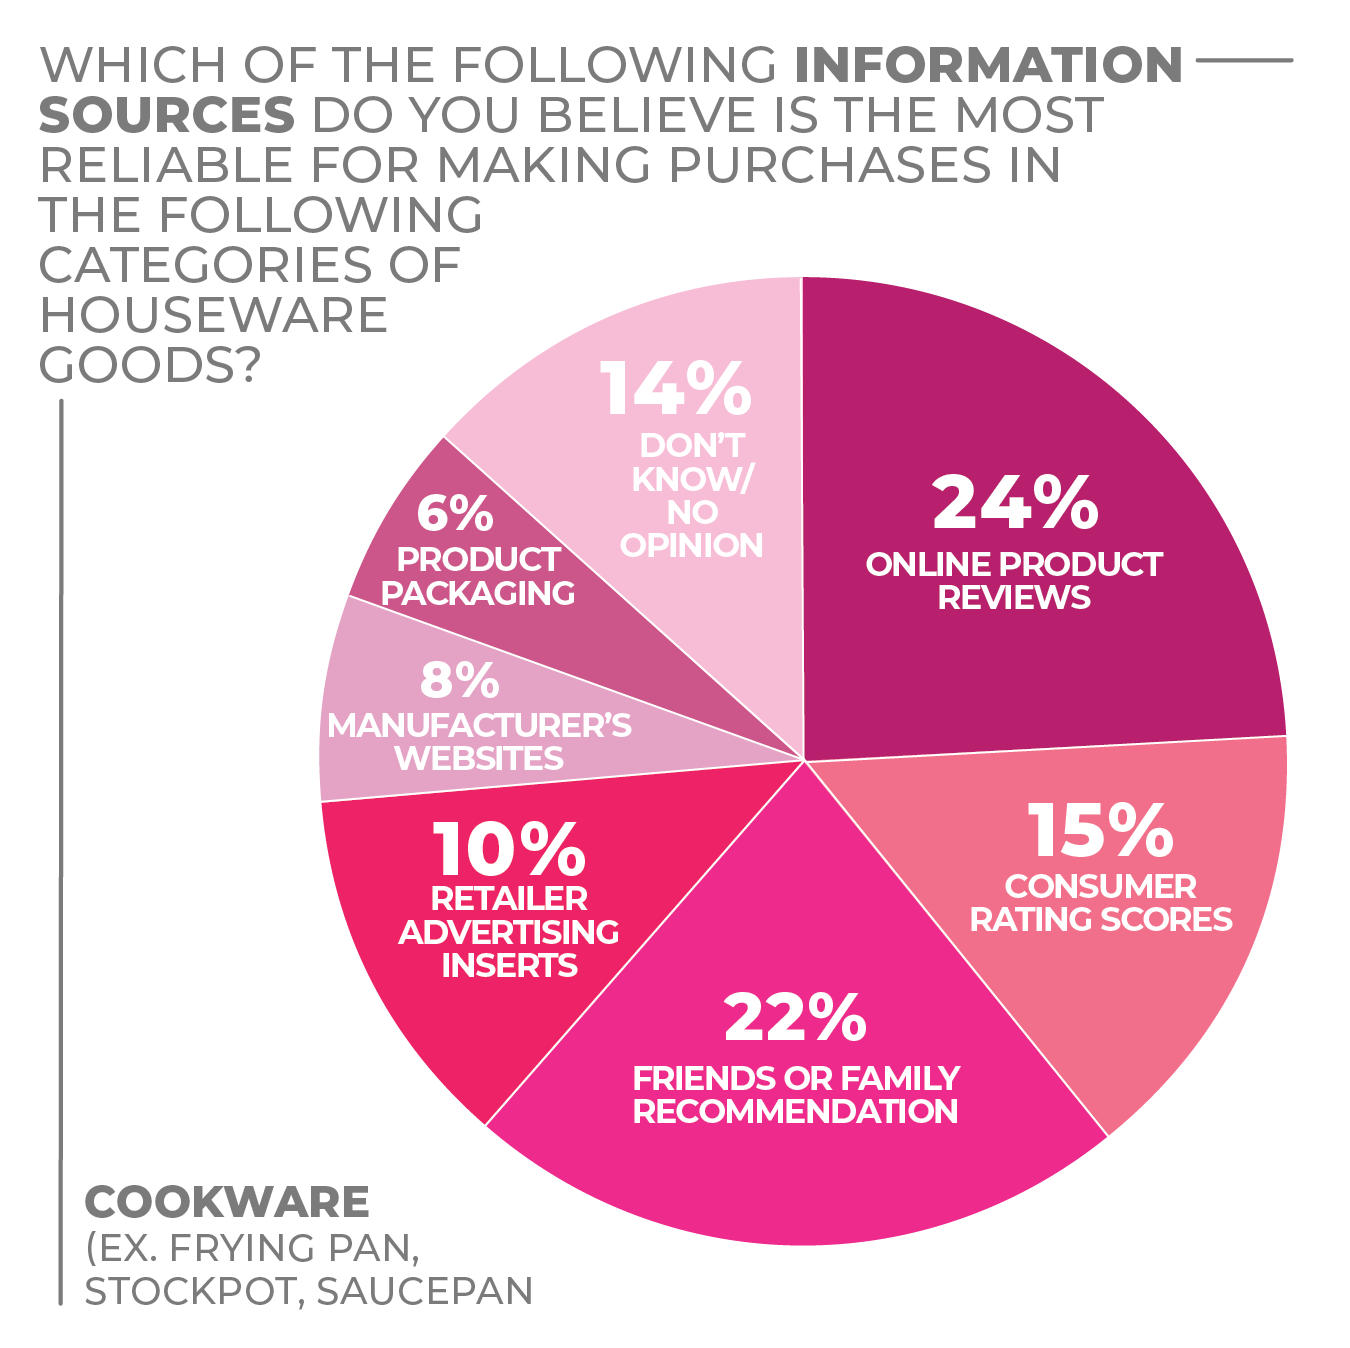
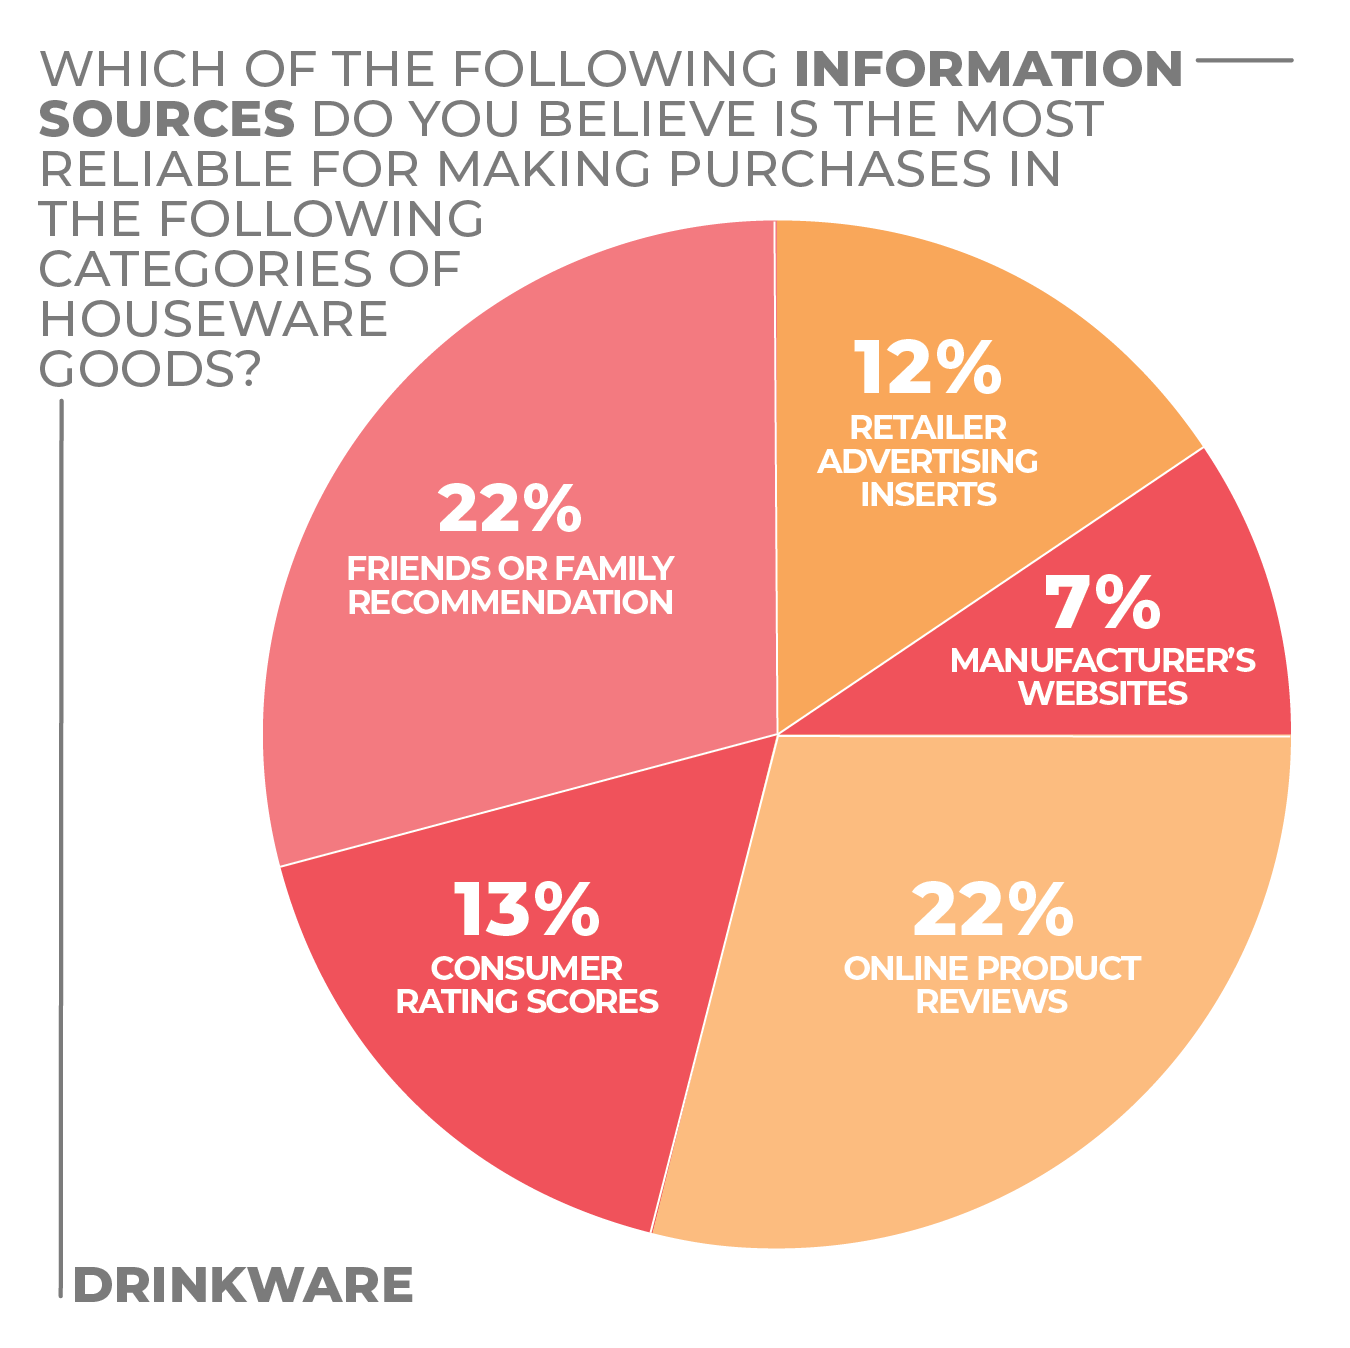
A sign of the times, the majority of respondents (24%) stated that they rely on online product reviews to be the most reliable when researching cookware, closely followed by friends or family recommendations (22%) and consumer ratings sources (16%).
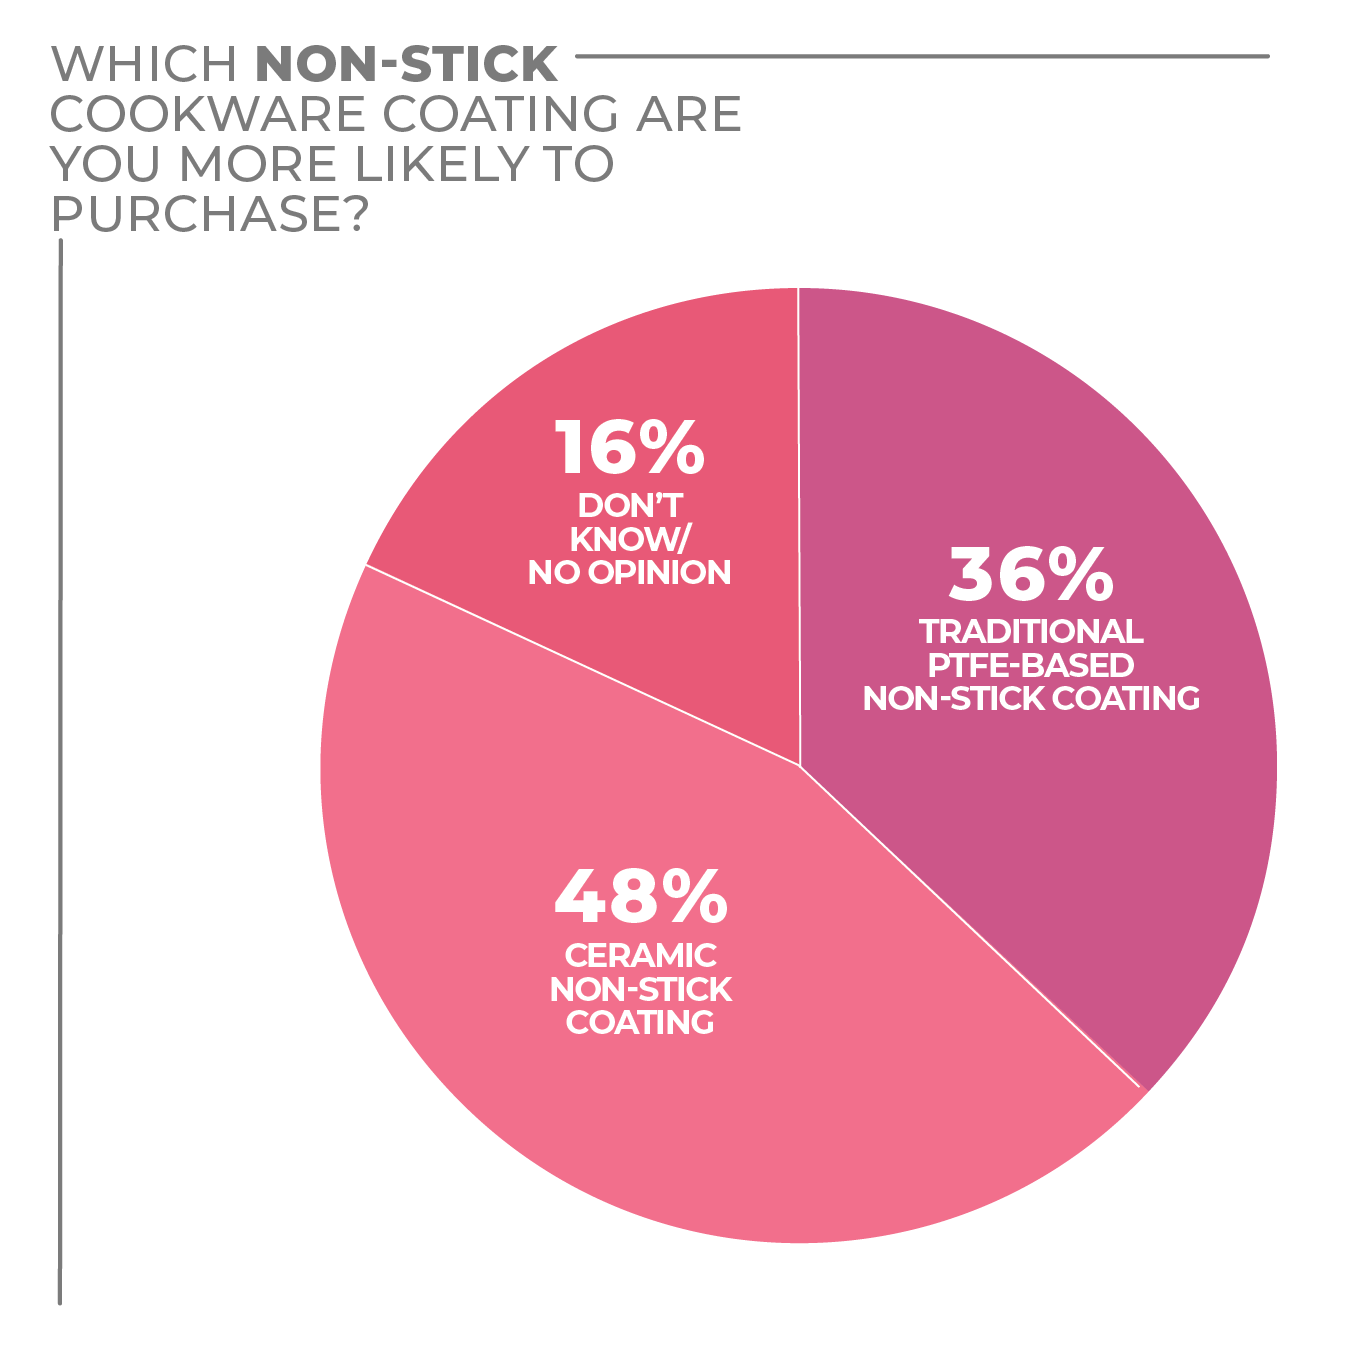
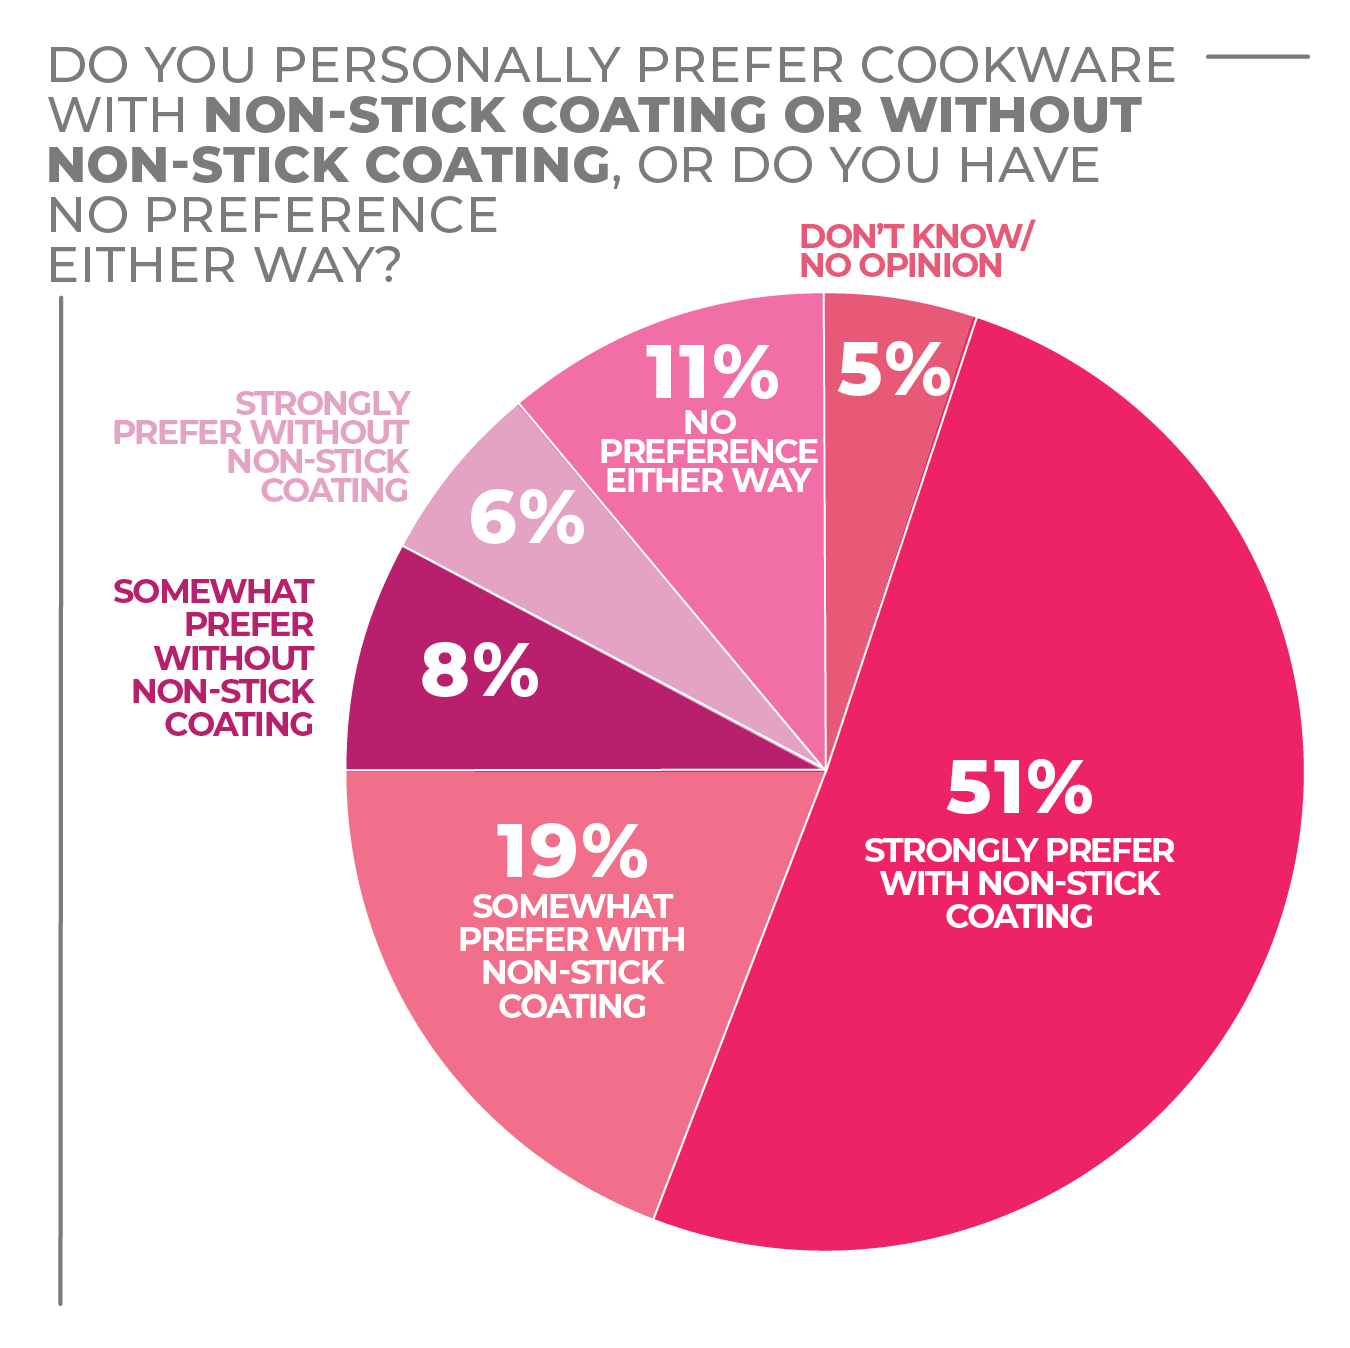
Similar to bakeware, survey respondents selected ceramic non-stick coating (48%) as their preferred coating choice, followed by traditional PTFE-based non-stick coating (36%).
More Cookware Findings:
Click on charts to enlarge.

Cutlery
Improved knife skills are in demand by a wide range of consumers, from seasoned pros and experienced home cooks to new home starters and college students cooking more often for themselves.
With many consumers preparing and cooking several meals and snacks a day, prepping ingredients is a major focus. The popularity of cooking shows has increased attention on how to properly use a knife. And many consumers are ready to upgrade to new knives to tackle their culinary adventures.
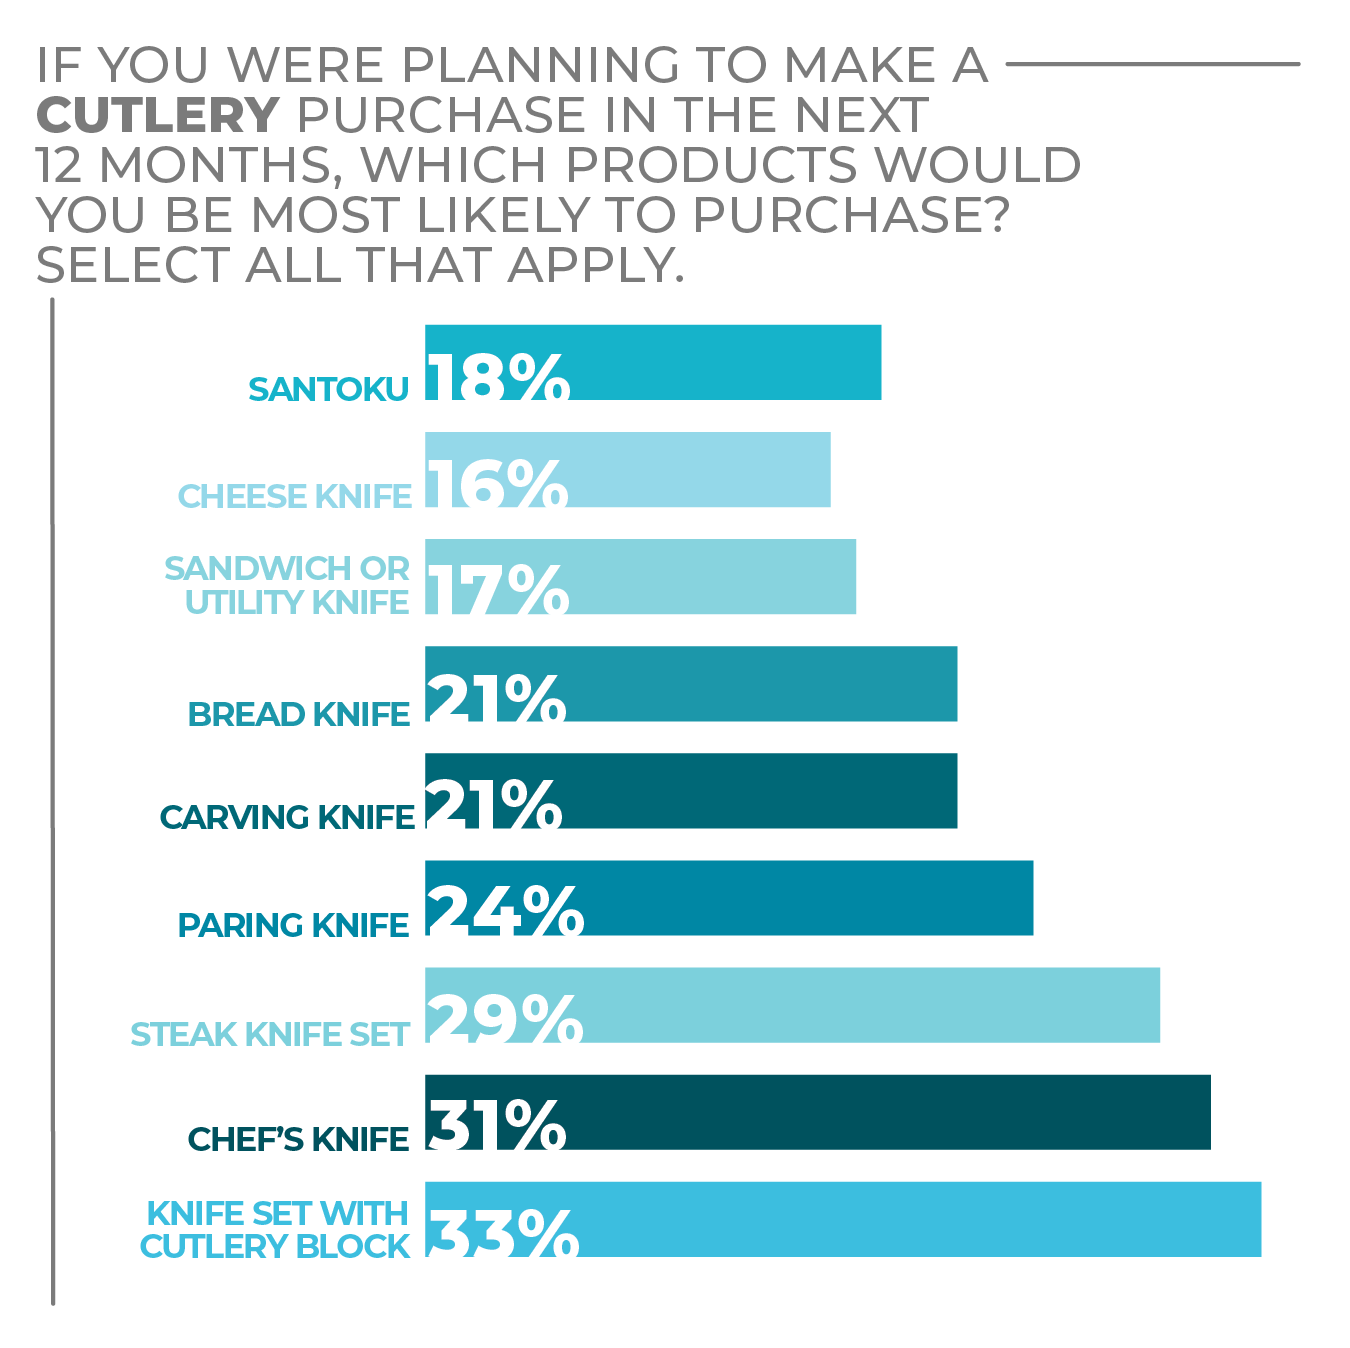
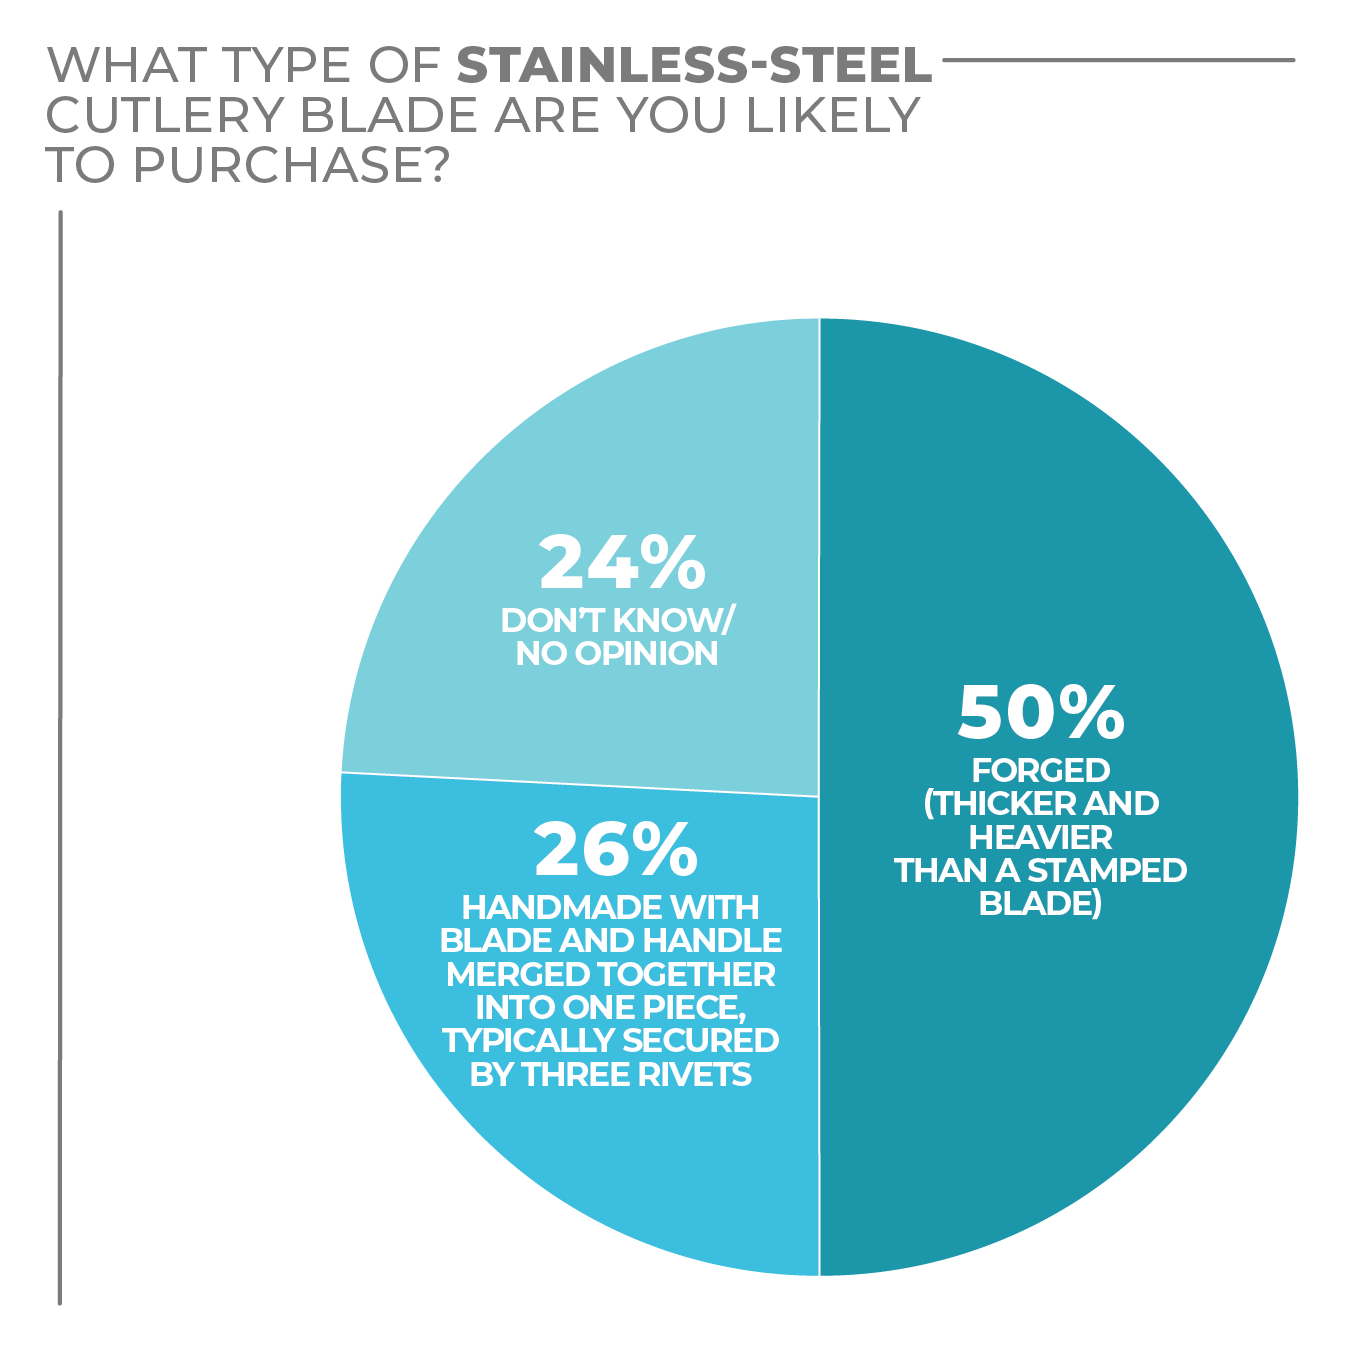
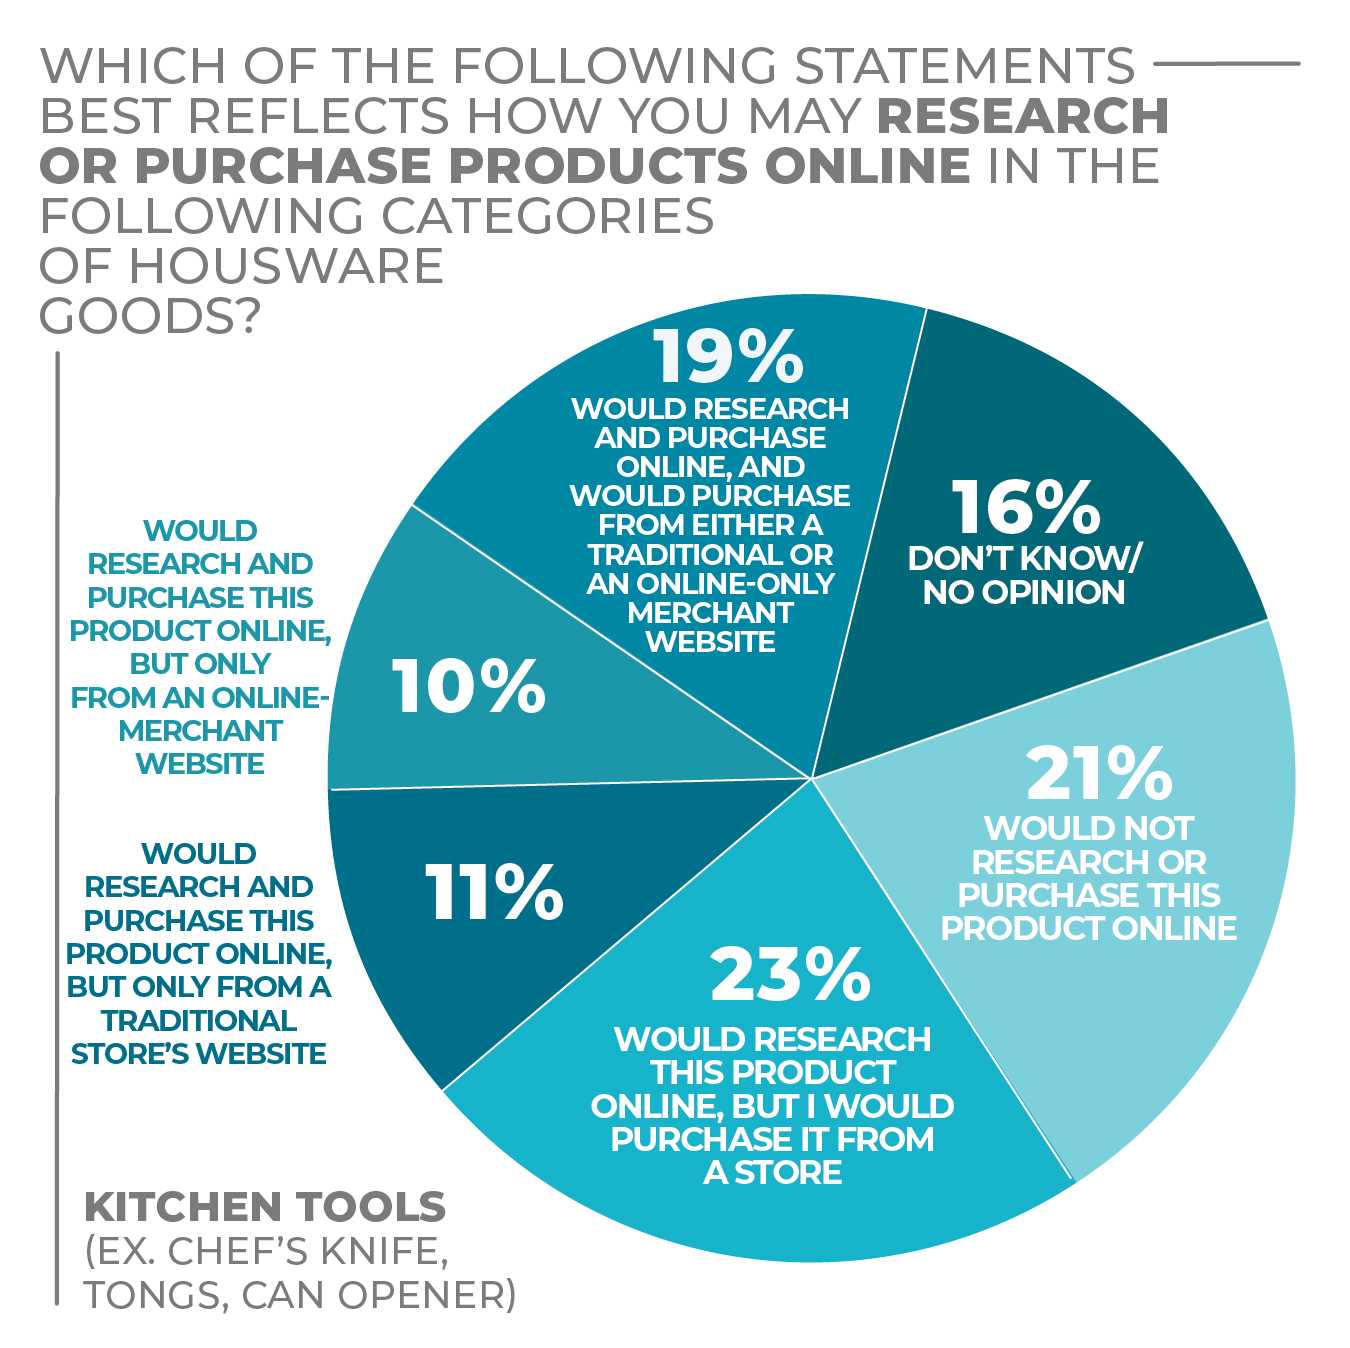
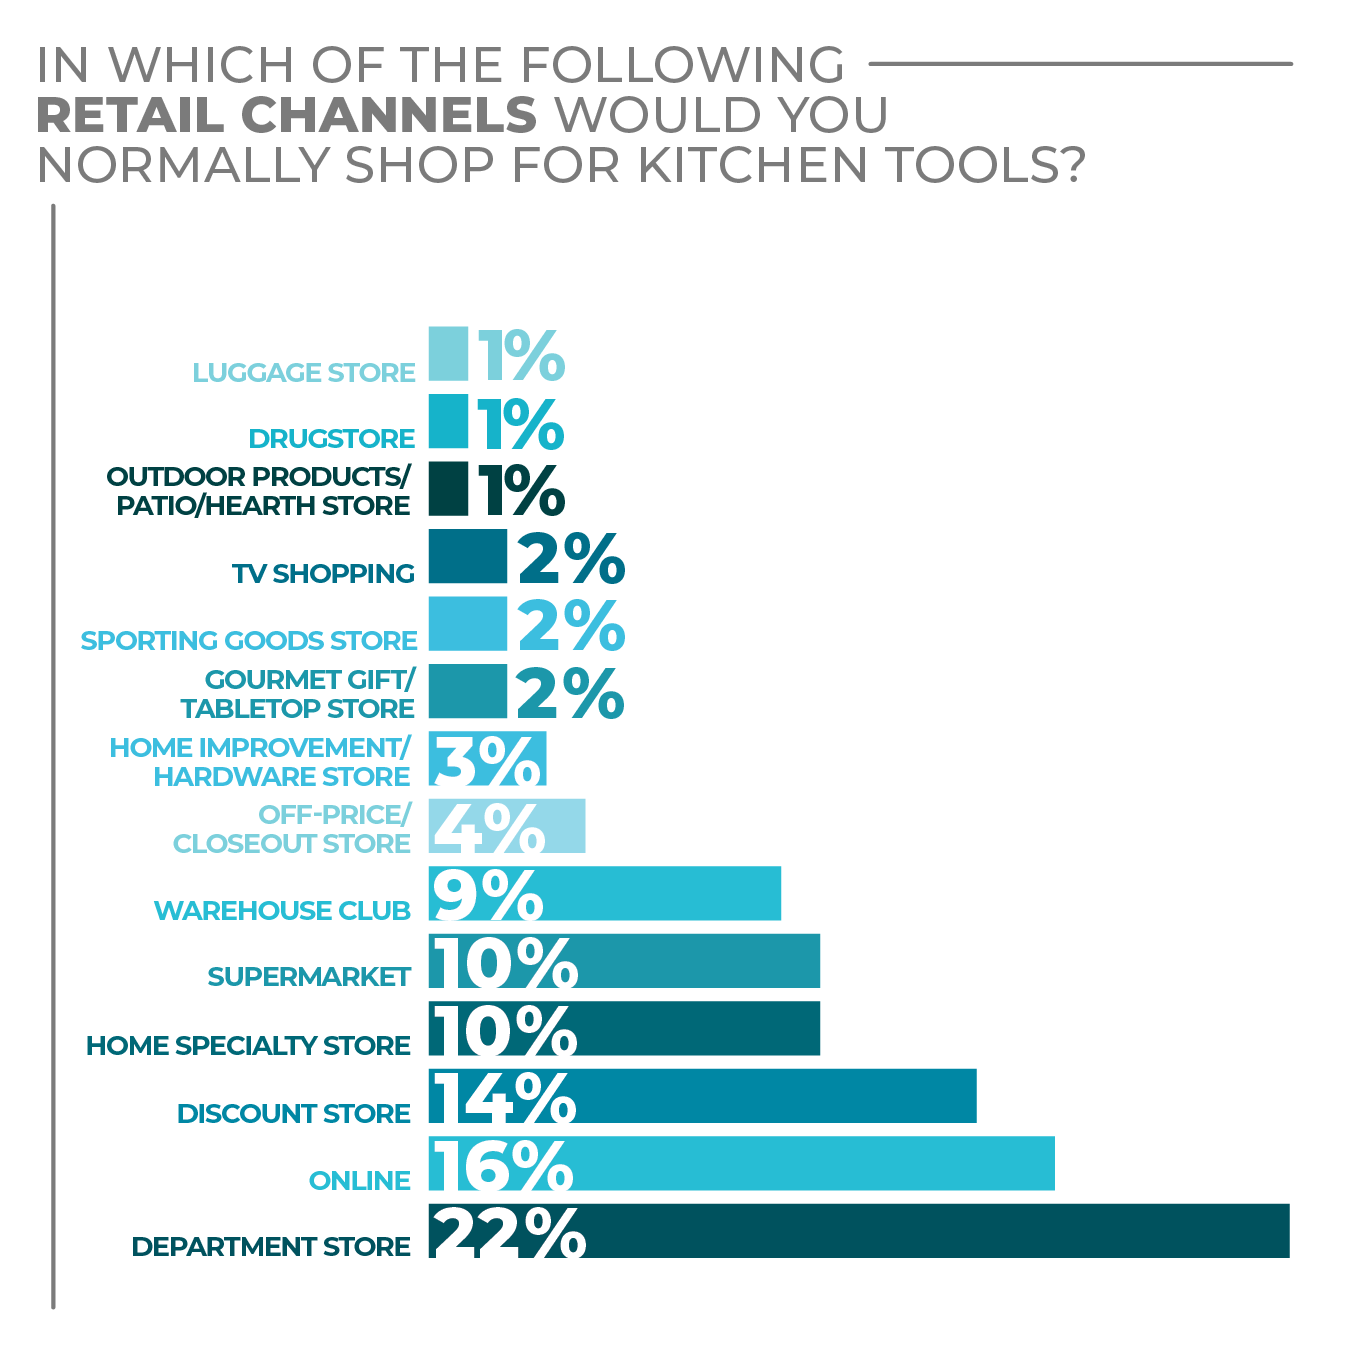
According to the recent HomePage News 2022 Consumer Outlook Survey, 58% of respondents stated they were somewhat or very likely to make a cutlery purchase in 2022. A knife set with a block was the top choice (33%) among preferred cutlery purchases. This could indicate consumers are more inclined to purchase a full, new set as they replace old and damaged knives; and/or they want a set to match updated kitchen décor.
Today’s knife blocks are often sleek, with added functionality to help fuel consumer interest. Blocks in mixed mediums, including wood and faux finishes that complement modern kitchen styles, are appealing to consumers, as are blocks with built-in knife sharpening mechanisms. Also gaining share are magnetic knife blocks that allow knives to be displayed horizontally with a visible profile, making them easier to grab and visually more compelling.
Cutlery has been through a transformation the past few years with major, with established manufacturers facing increased competition from smaller companies boasting artisanal, handcrafted knives. As such, many veteran cutlery suppliers have realigned their marketing efforts to a lifestyle approach to fortify the consumer connection between quality cutlery and the meals they are prepping.
More Cutlery Findings:
Click on charts to enlarge.

Dinnerware
With consumers cooking more often at home, dinnerware use frequency has been commensurate. Consequently, one of the biggest shifts in the dinnerware category has been the attention to style, material and texture.
As consumer tastes have changed, so has the way vendors approach product development. With a bevy of design motifs available to consumers, according to the recent HomePage News 2022 Consumer Outlook Survey, the most respondents (29%) stated they prefer a modern/contemporary style, with 25% selecting a solid/single color and 21% selecting plain white as their top choice. It should be noted that 18% of respondents selected a mix-and-match pattern as their preference, which underscores the shift to the more eclectic style toward which younger consumers have gravitated the past few years.
Industry insiders say retail customers are seeking dinnerware themes that, while not as matched as traditional patterns, have cohesively styled, complementary pieces.
Self-expression is an increasingly important attribute among consumers, especially Millennials and their younger Gen Z counterparts. Personal lifestyle choices have become front and center, and these consumers are tuned in to how their purchase choices represent themselves in their homes and at their dinner tables.
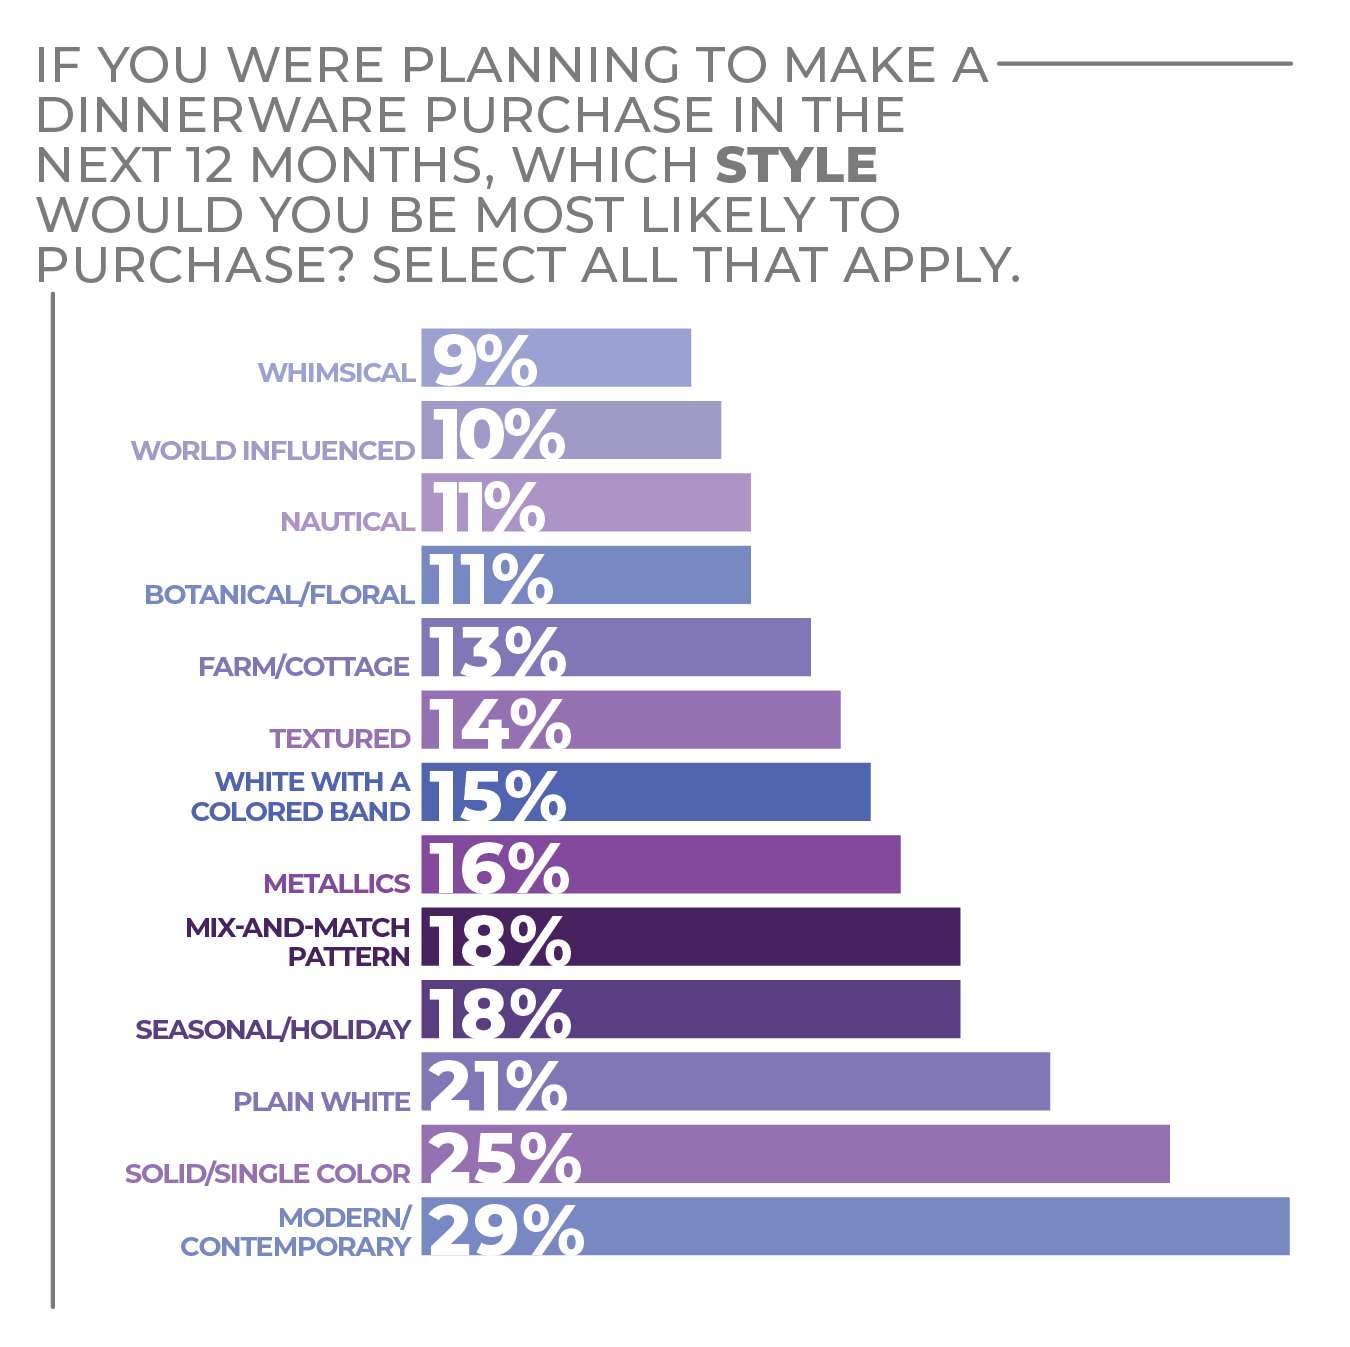
Casual dinnerware selections that have an artisanal look have been one of the biggest results of this shift, which is reflected in desired material choices from consumers.
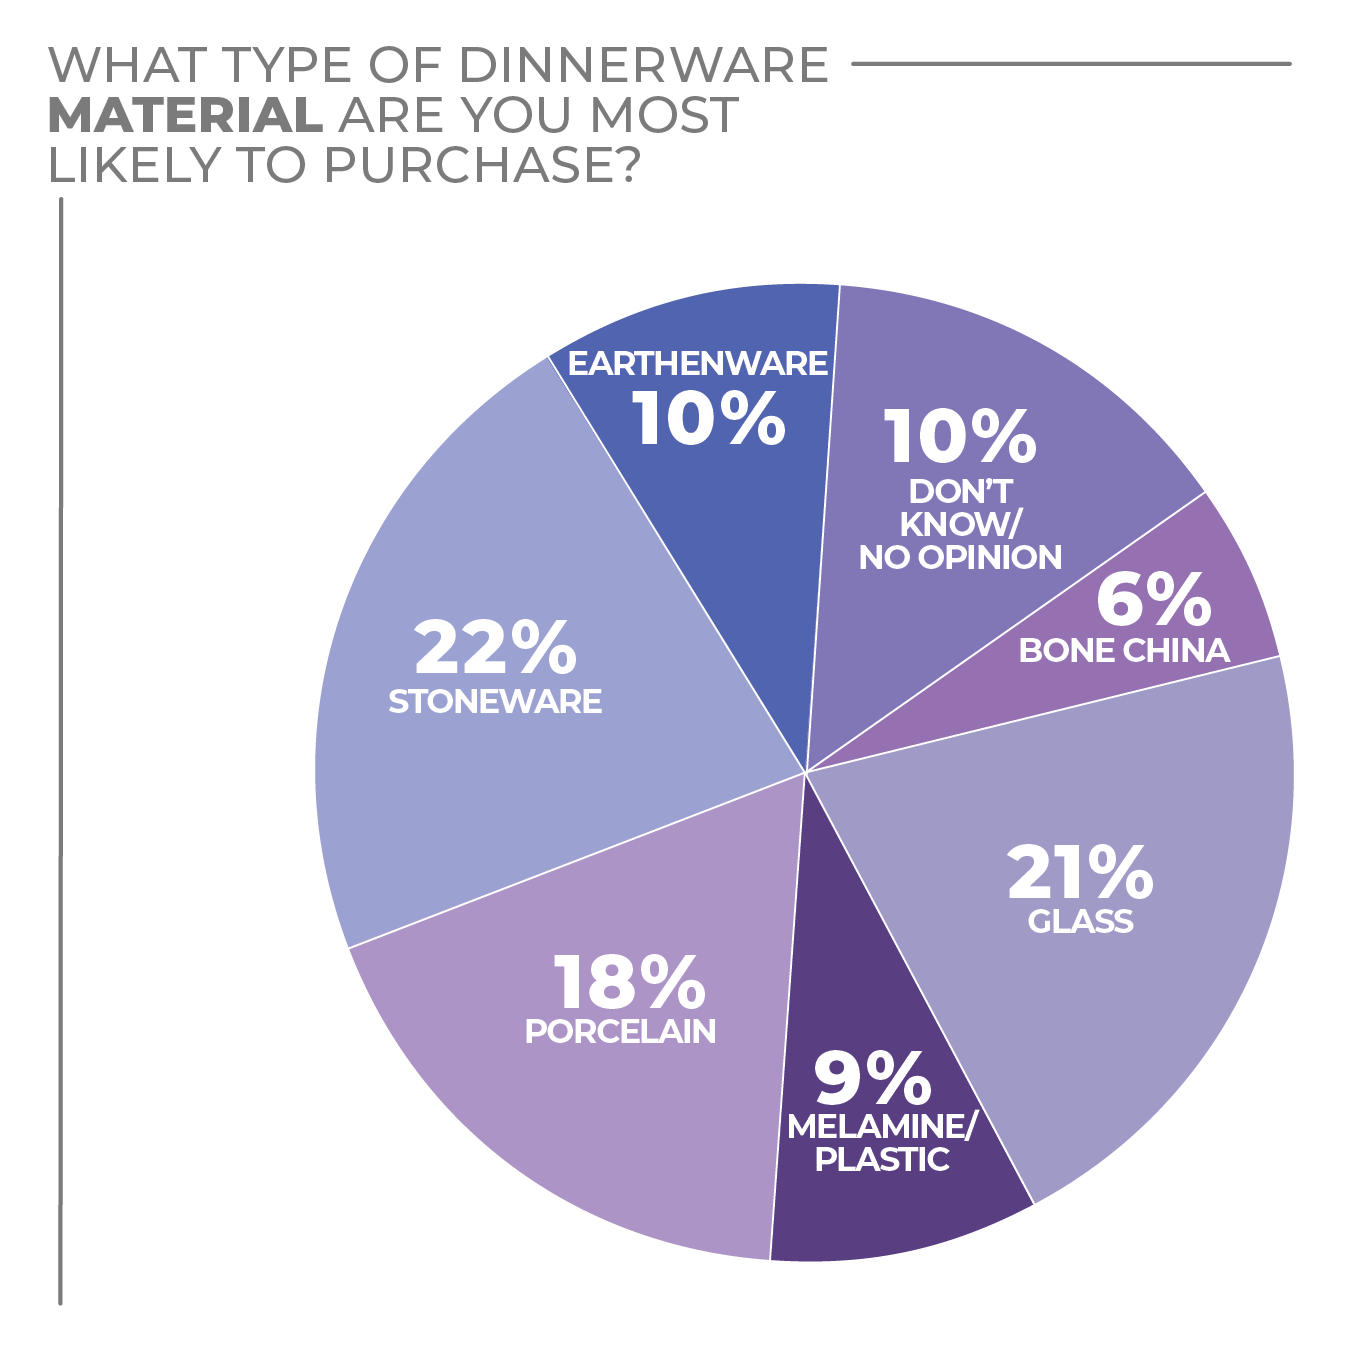
Stoneware leads the way as the dinnerware material of choice, selected by 22% of survey respondents, followed closely by glass (21%) and porcelain (18%). Bone china only earned 6% of responses, echoing the shift from formal to more casual dinnerware.
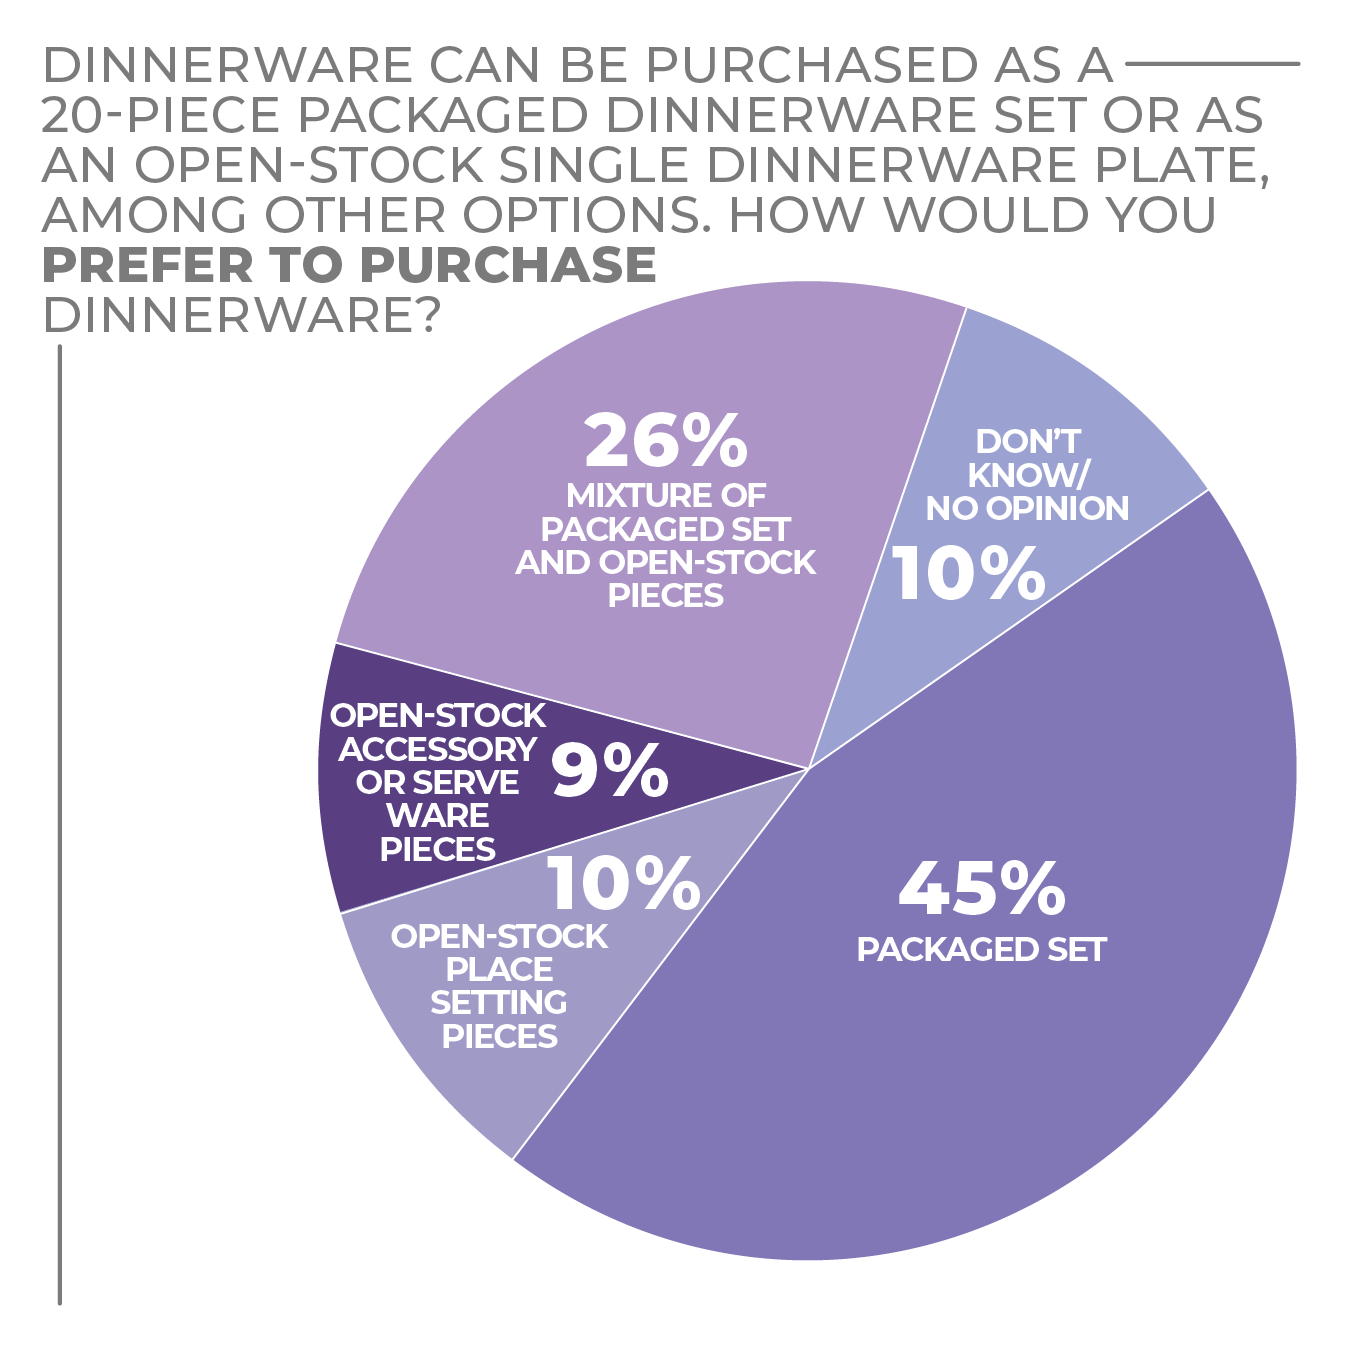
As for how consumers prefer to purchase their dinnerware, sets, while still popular, continue to decline, said industry vendors, especially as consumers seek open-stock pieces that add a new accent to their existing pieces.
According to survey respondents, 45% prefer to purchase their dinnerware in packaged sets, while 26% prefer a mix of packaged and open-stock pieces. This shift was recently reflected in new dinnerware introductions. Vendors reconfigured smaller sets, nixing mugs, which are more popular sold individually, and instead included larger, low-shouldered bowls, which have become a more preferred, more versatile serving accessory.
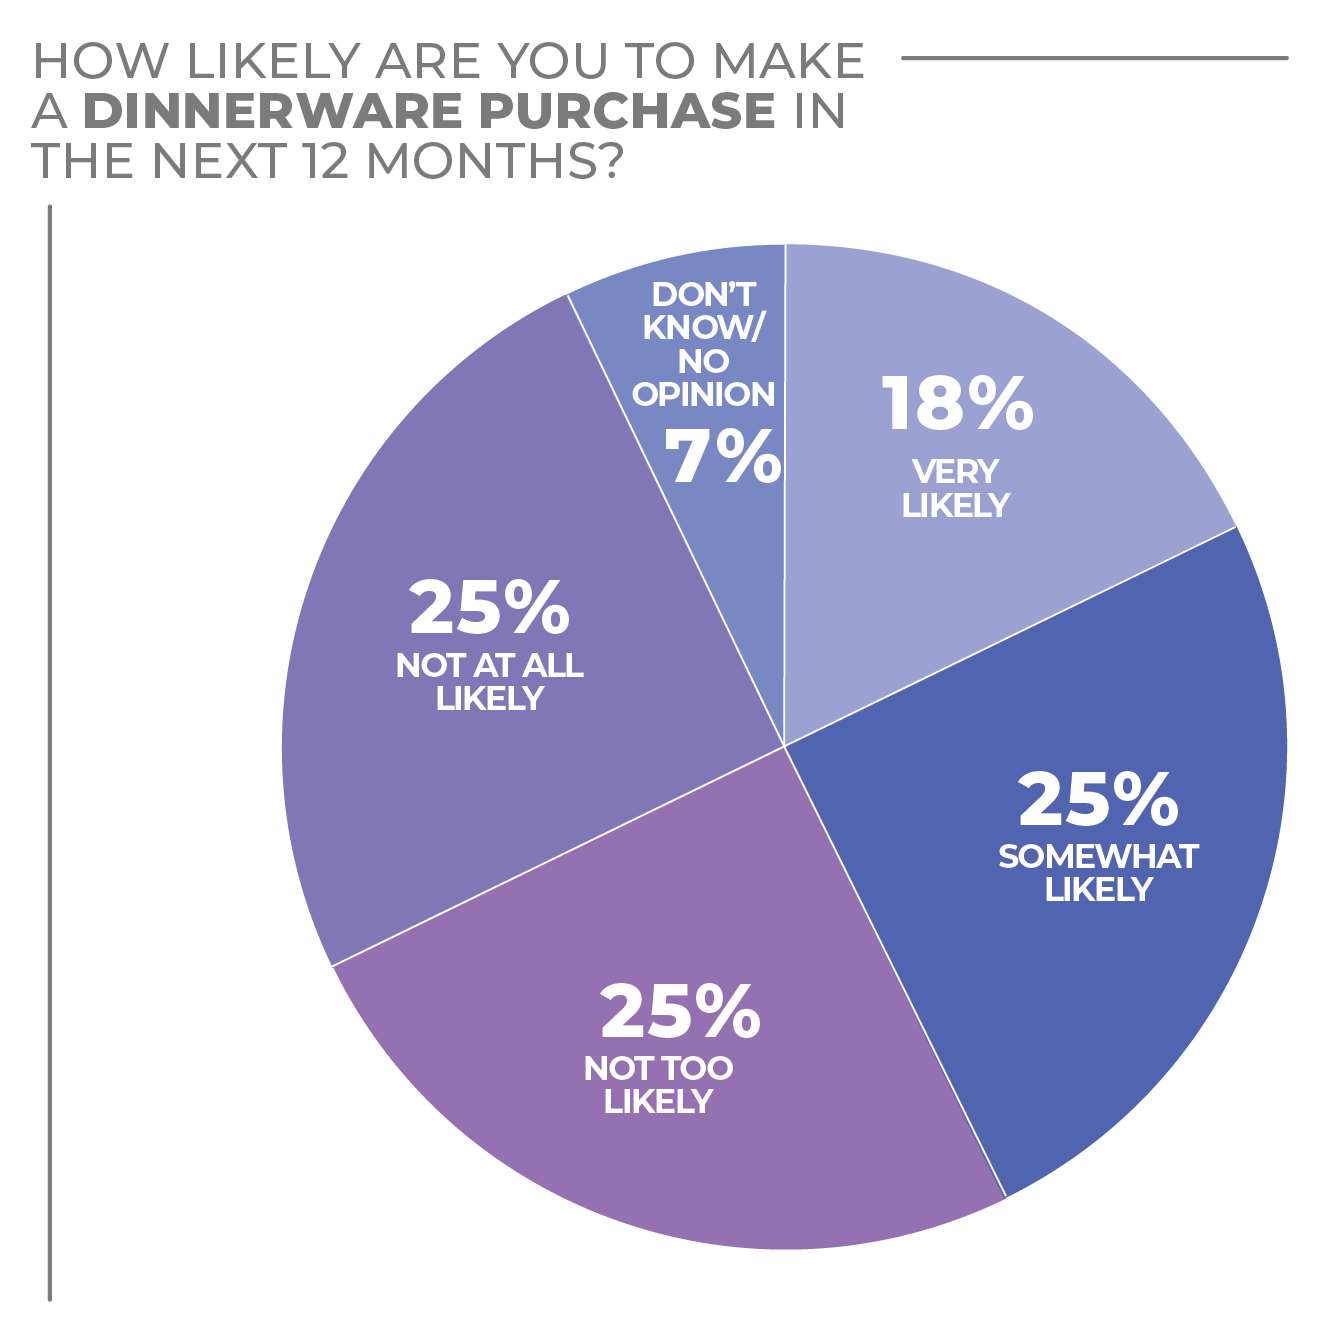
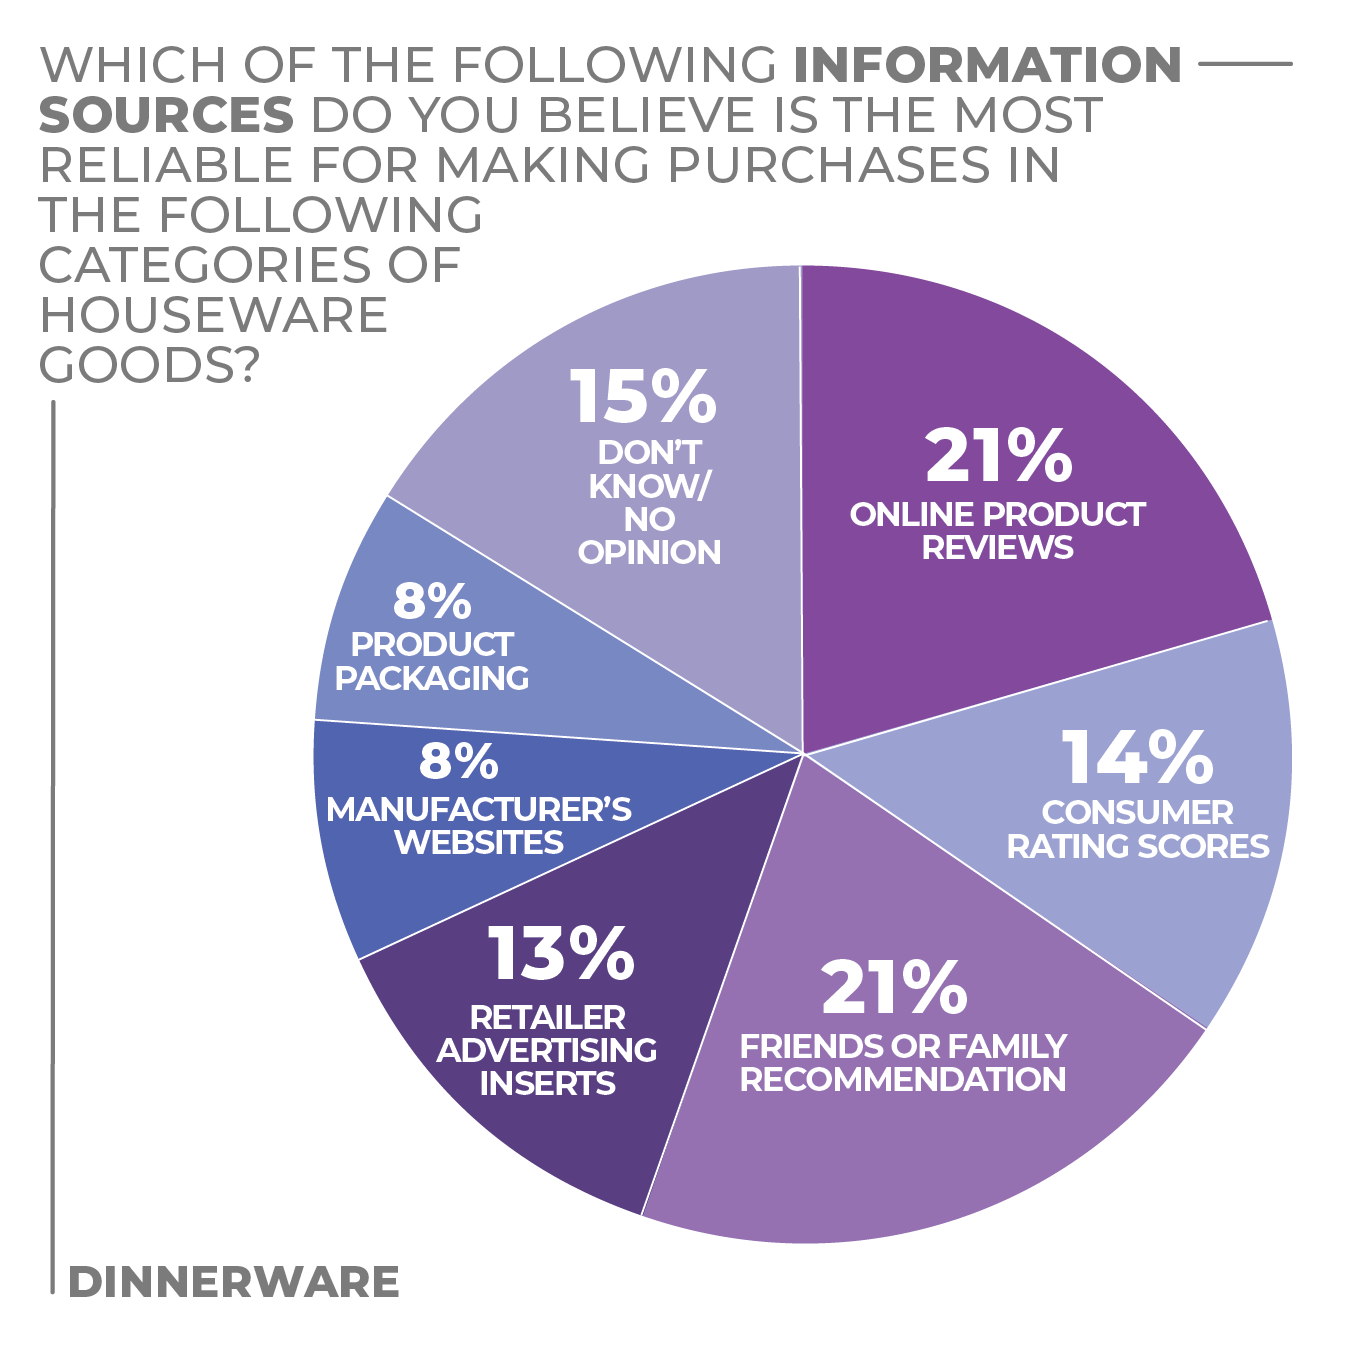
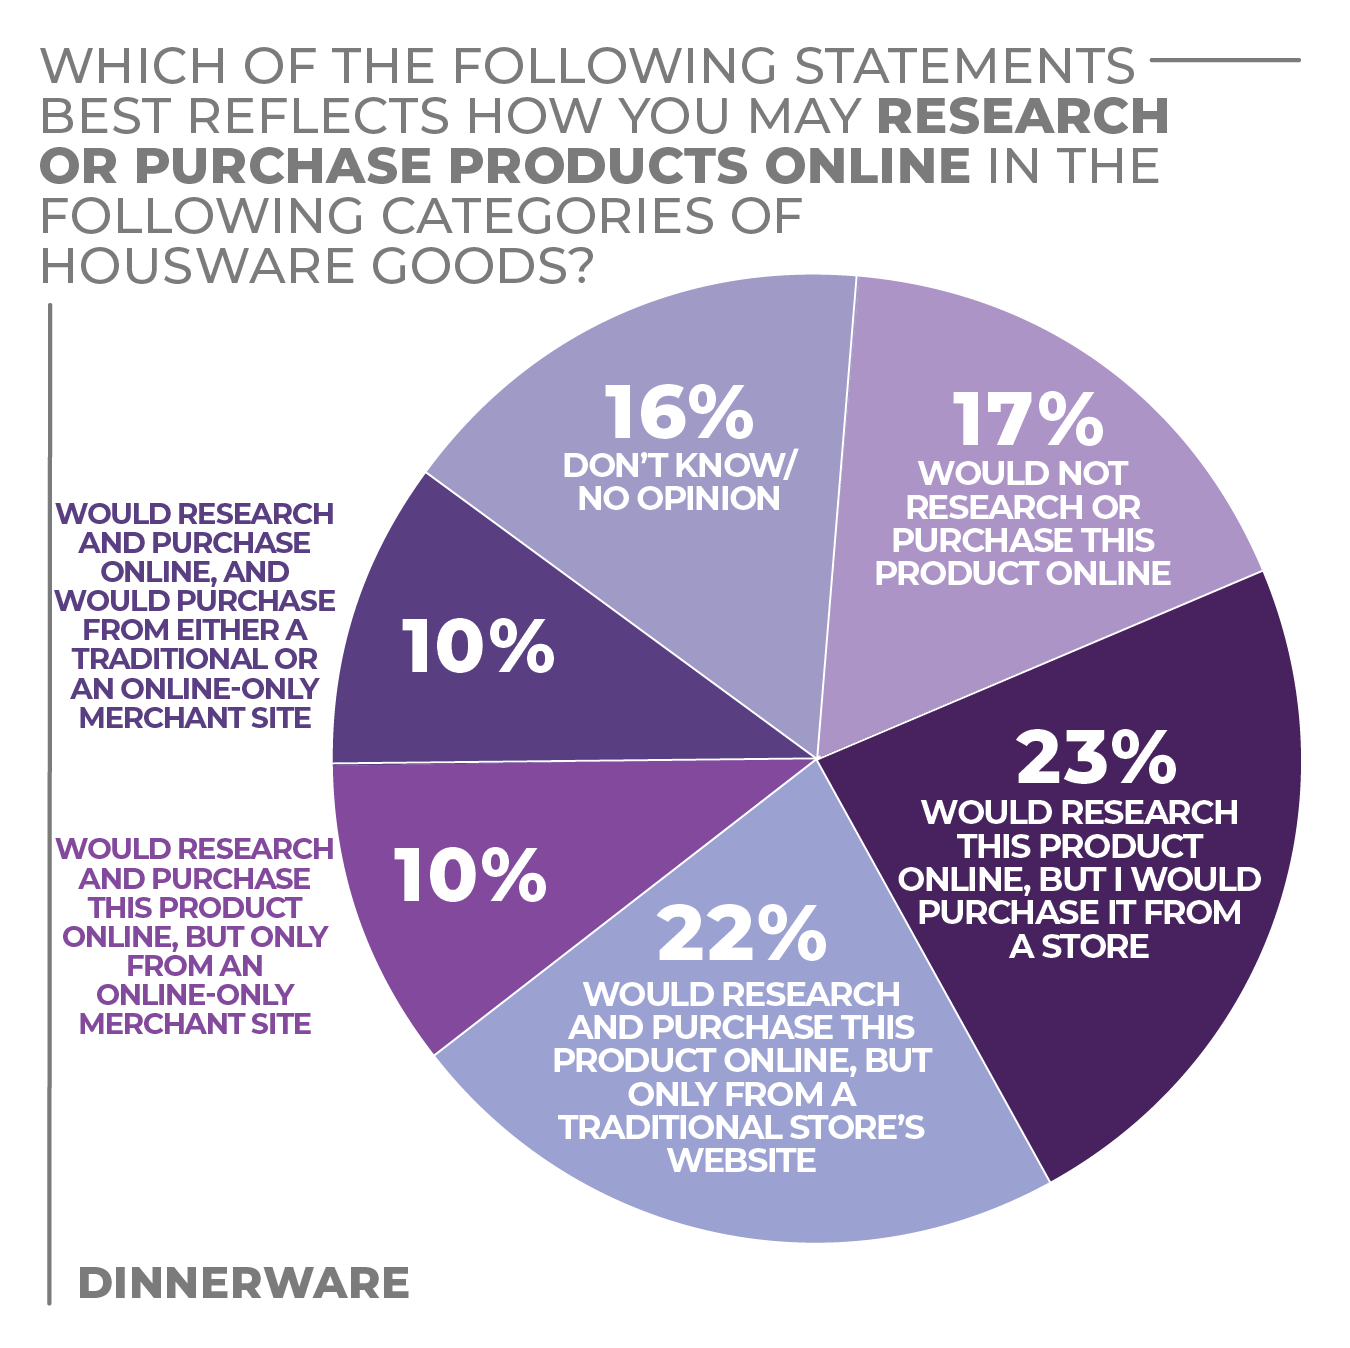
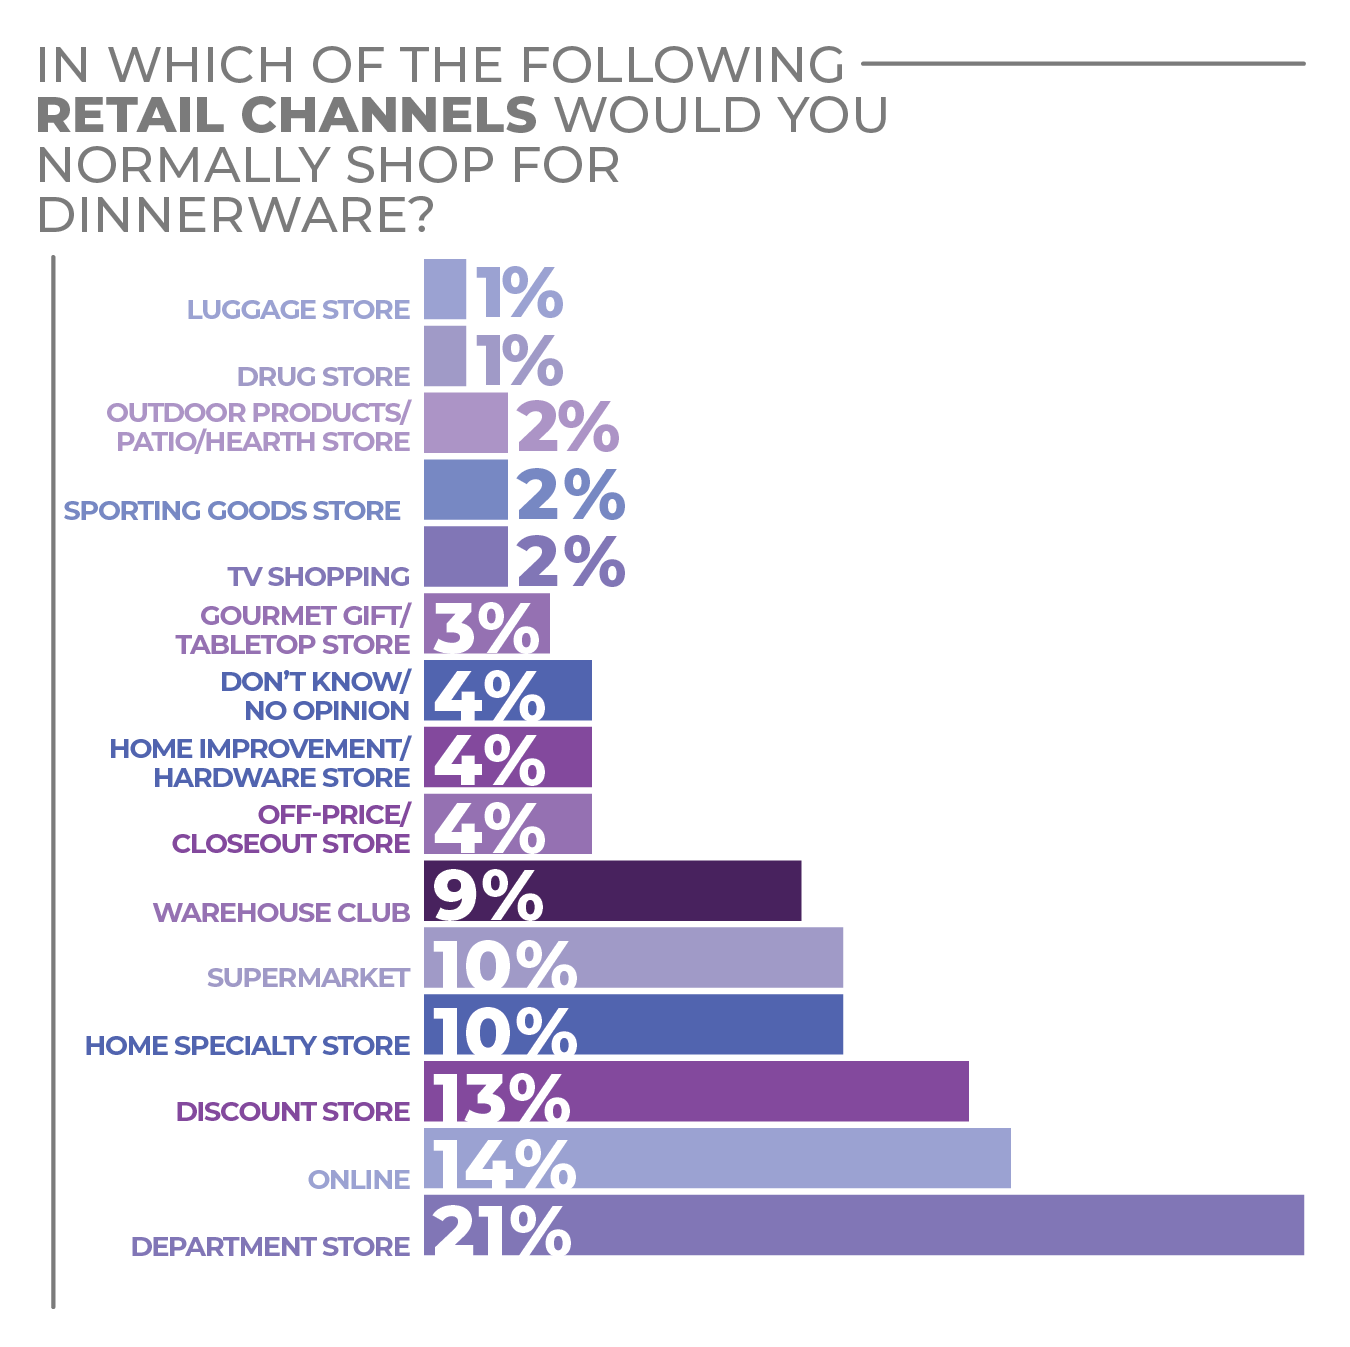
Respondents were split on whether they would make a dinnerware purchase in the next 12 months. 50% said they were not likely to, while 43% said they were somewhat or very likely to do so. Survey respondents stated they were most likely to make their dinnerware purchase at a department store (21%), online (14%) or at a discount store (13%).
More Dinnerware Findings:
Click on charts to enlarge.
Flatware
Gathering around the table has taken on a new meaning as family, roommates and friends strive to spend quality time together whether in person or virtually.
The increase in sharing of meals made at home via social media photos also has prompted consumers to take stock of their “props,” making sure to showcase the tabletop pieces that mean the most to them — and reflect their personal style.
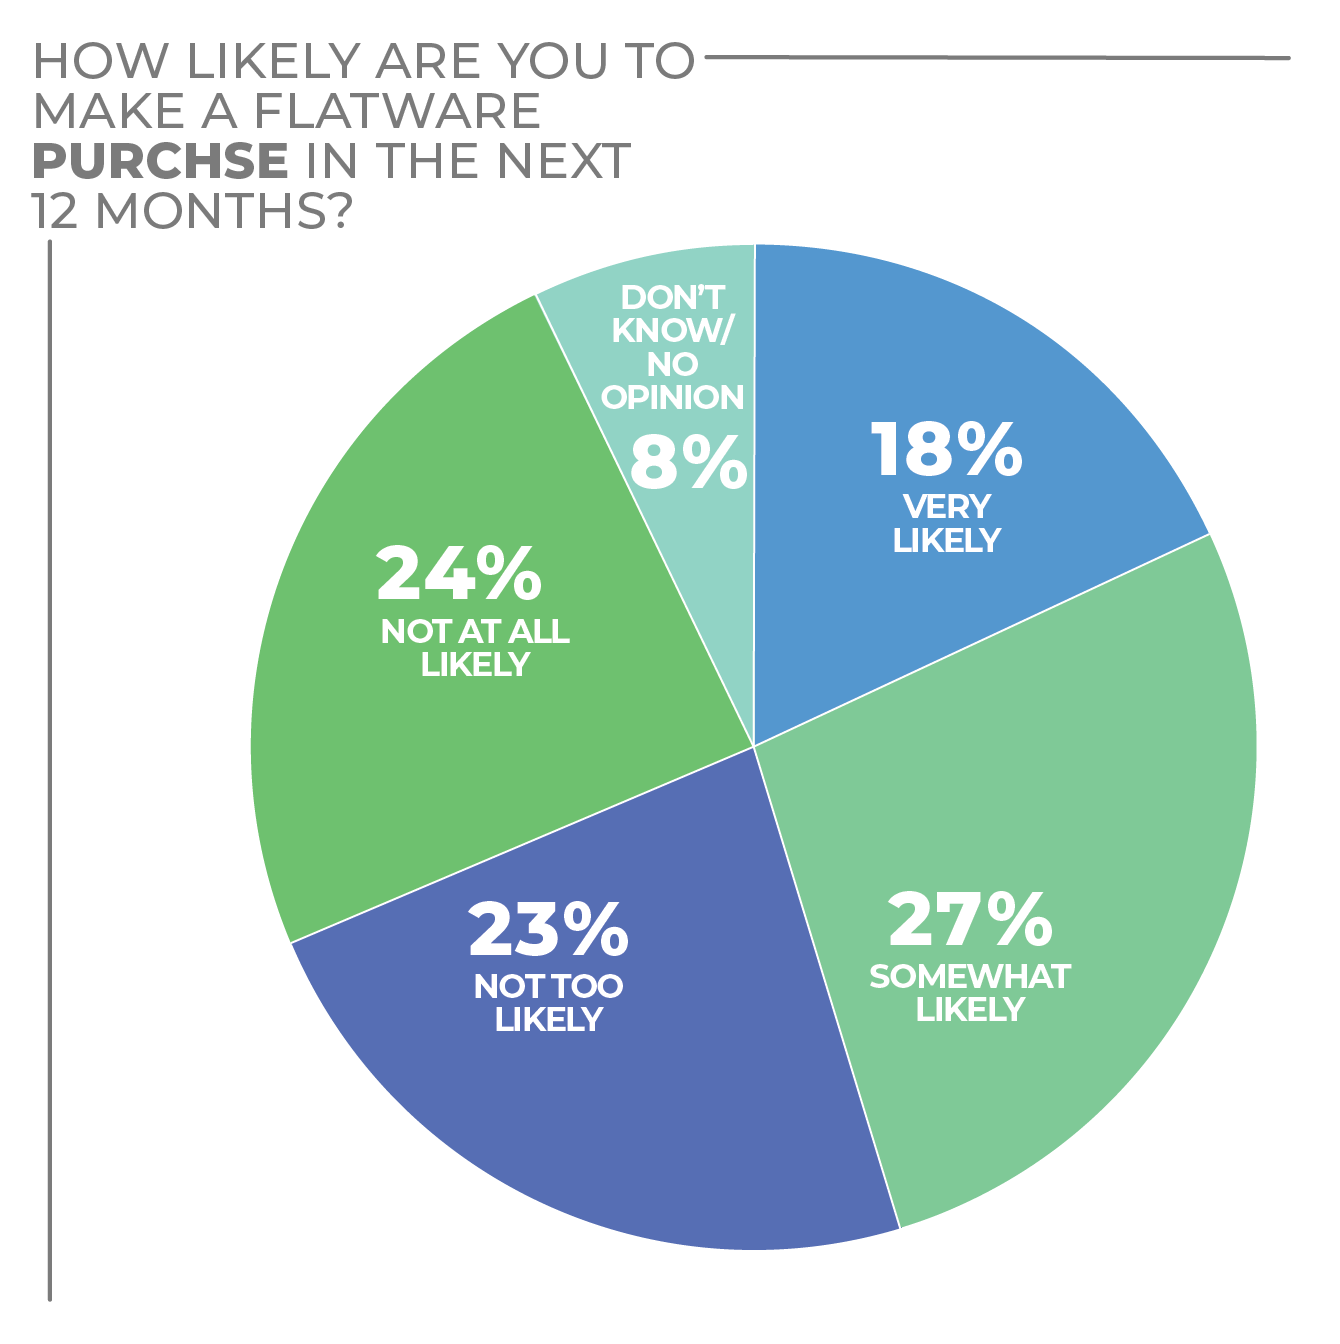
Flatware, for such reasons, has experienced recharged retail sales growth. According to the HomePage News 2022 Consumer Outlook Survey, 27% of respondents stated they were somewhat likely to make a flatware purchase in the next 12 months, while 18% stated they were very likely.
With that, flatware vendors have turned their attention to form and function with new designs, often tapping into consumer research to gauge what consumers want. Changing tastes in personal style, such as a gravitation toward modern farmhouse and industrial-chic décor themes, has led many manufacturers to offer designs to complement such popular motifs.
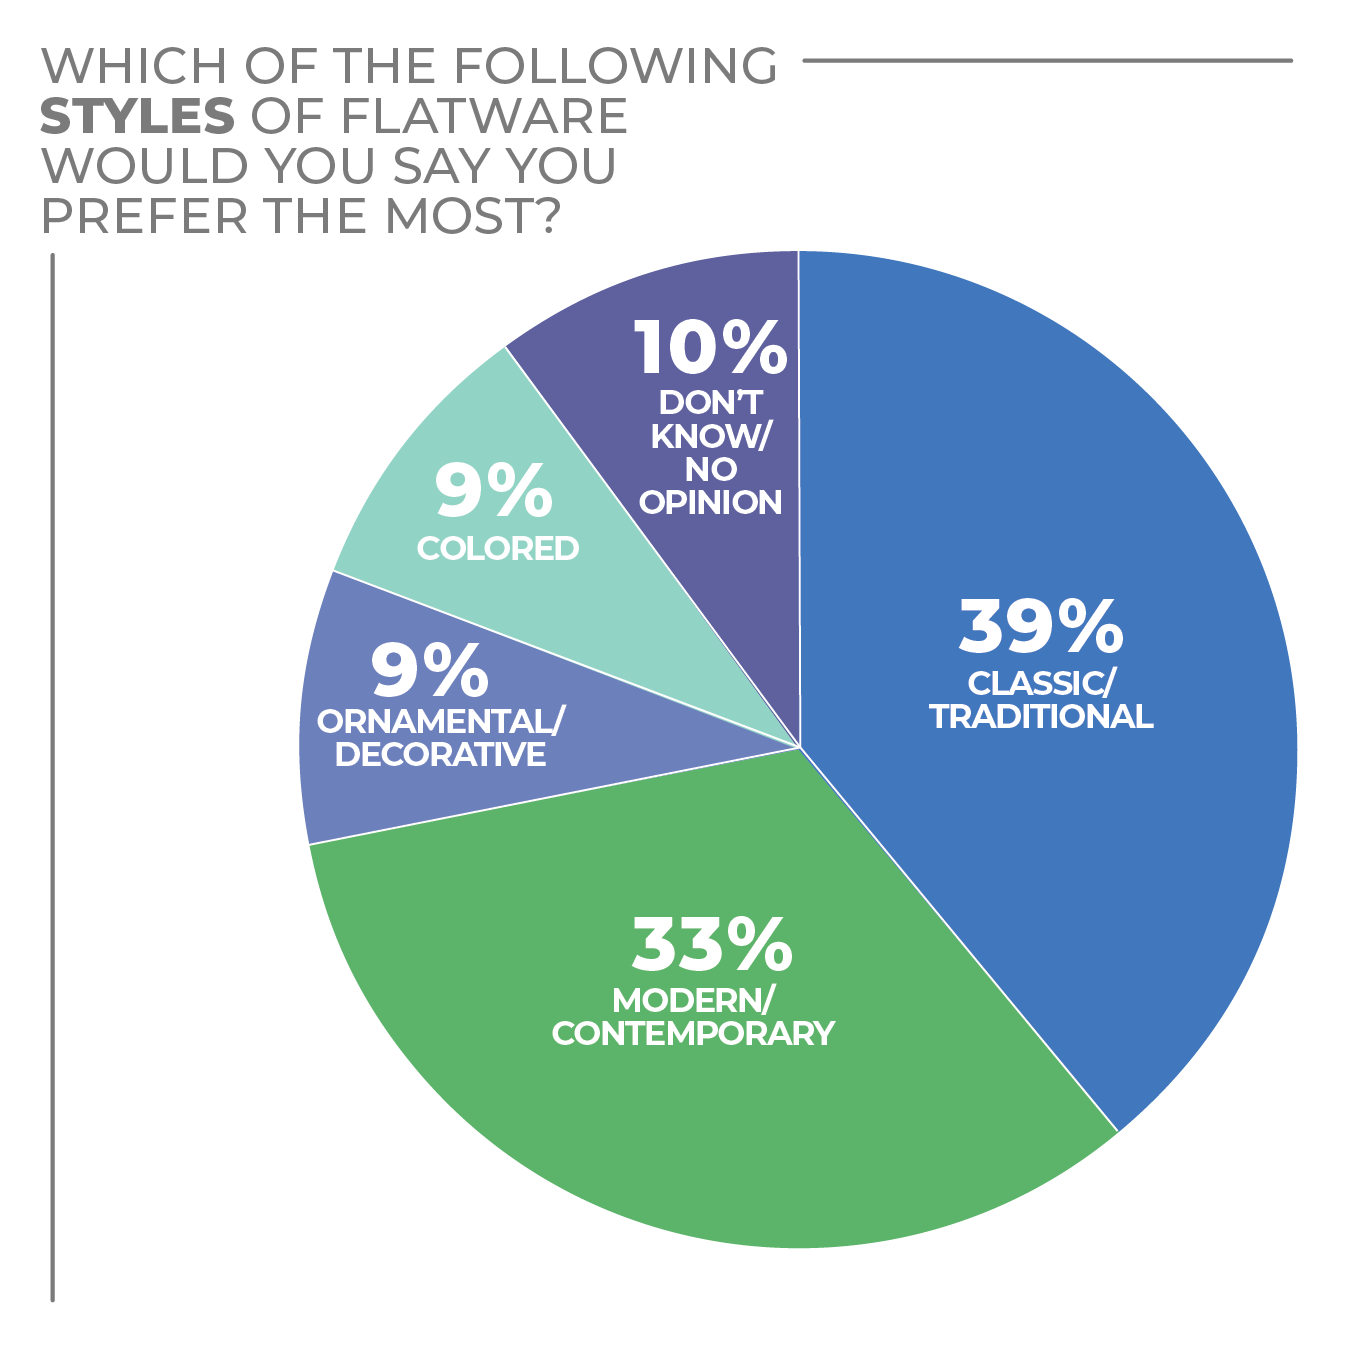
When it comes to flatware designs, consumers are split on their most preferred style, with 39% selecting classic/traditional, 33% selecting modern/contemporary and less than 10% selecting ornate or colored flatware. While style preferences have remained steady, vendors have zeroed in on texture and finish as design qualities through which they can attract consumers with new ideas.
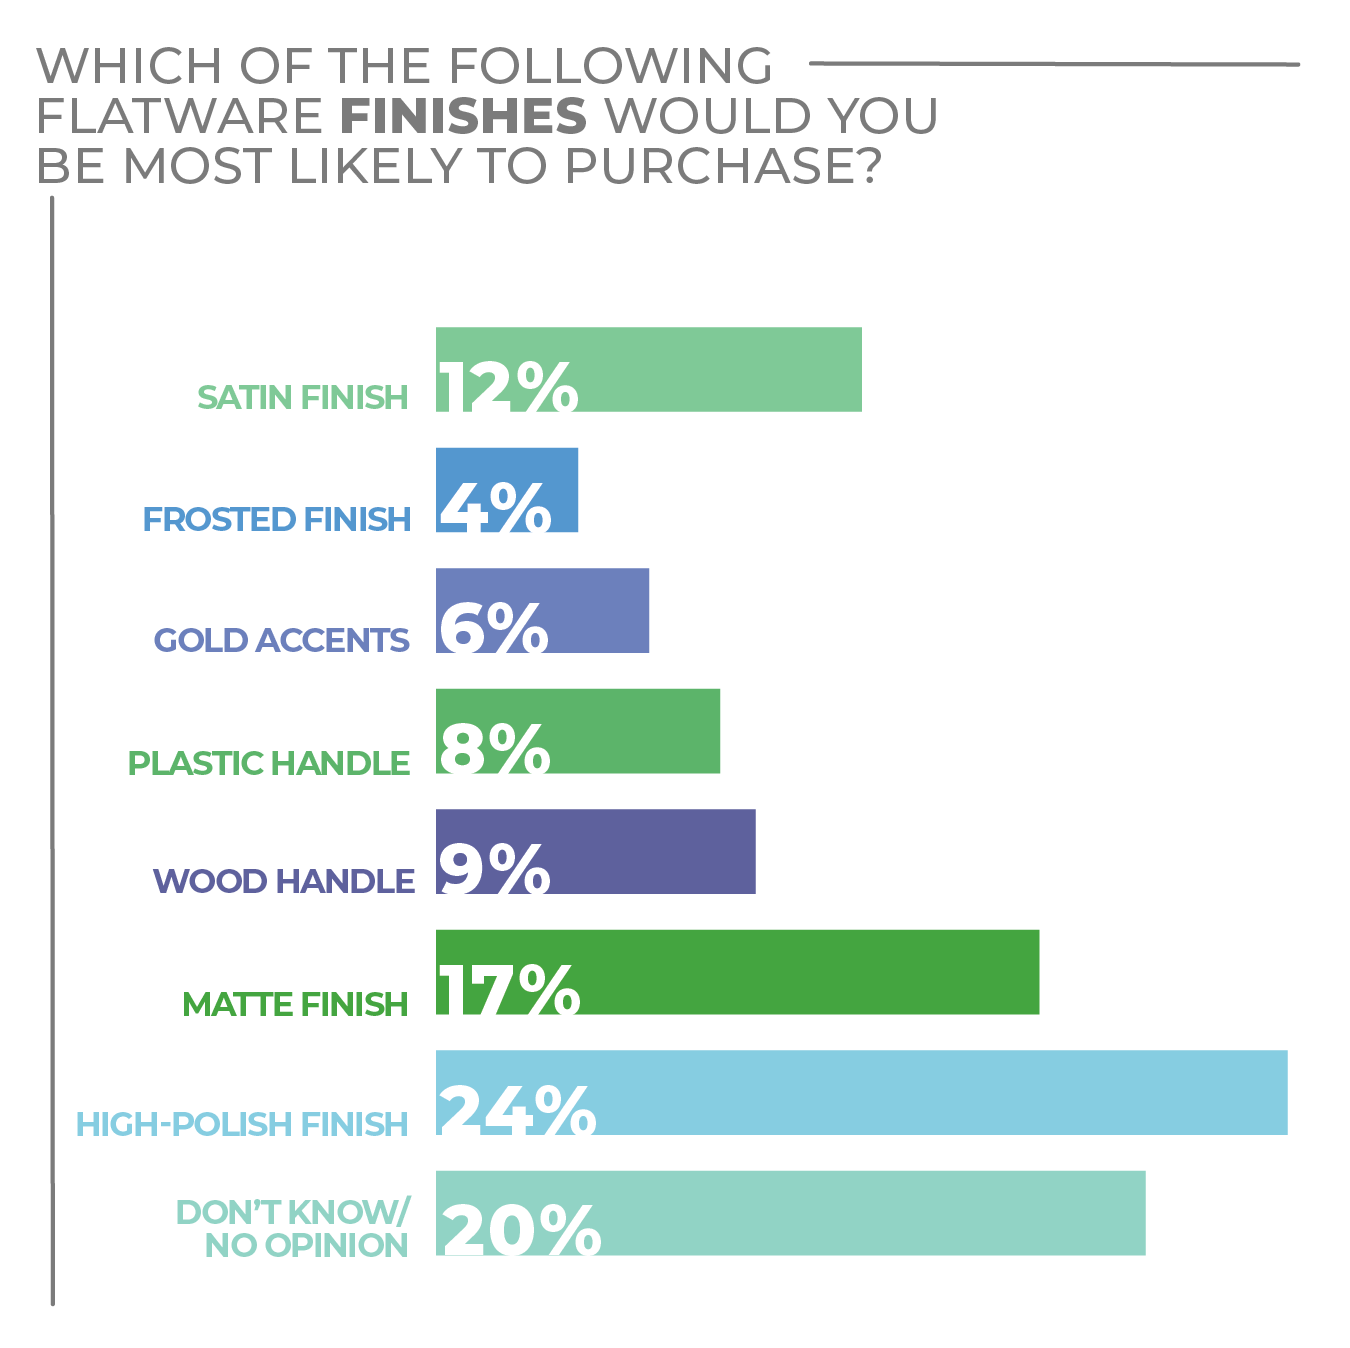
The majority of consumers selected matte (17%) and satin (12%) as their top flatware finish picks. Wood handles was next at 9%, indicating a shift to a more modern, yet still natural, tactile style preference.
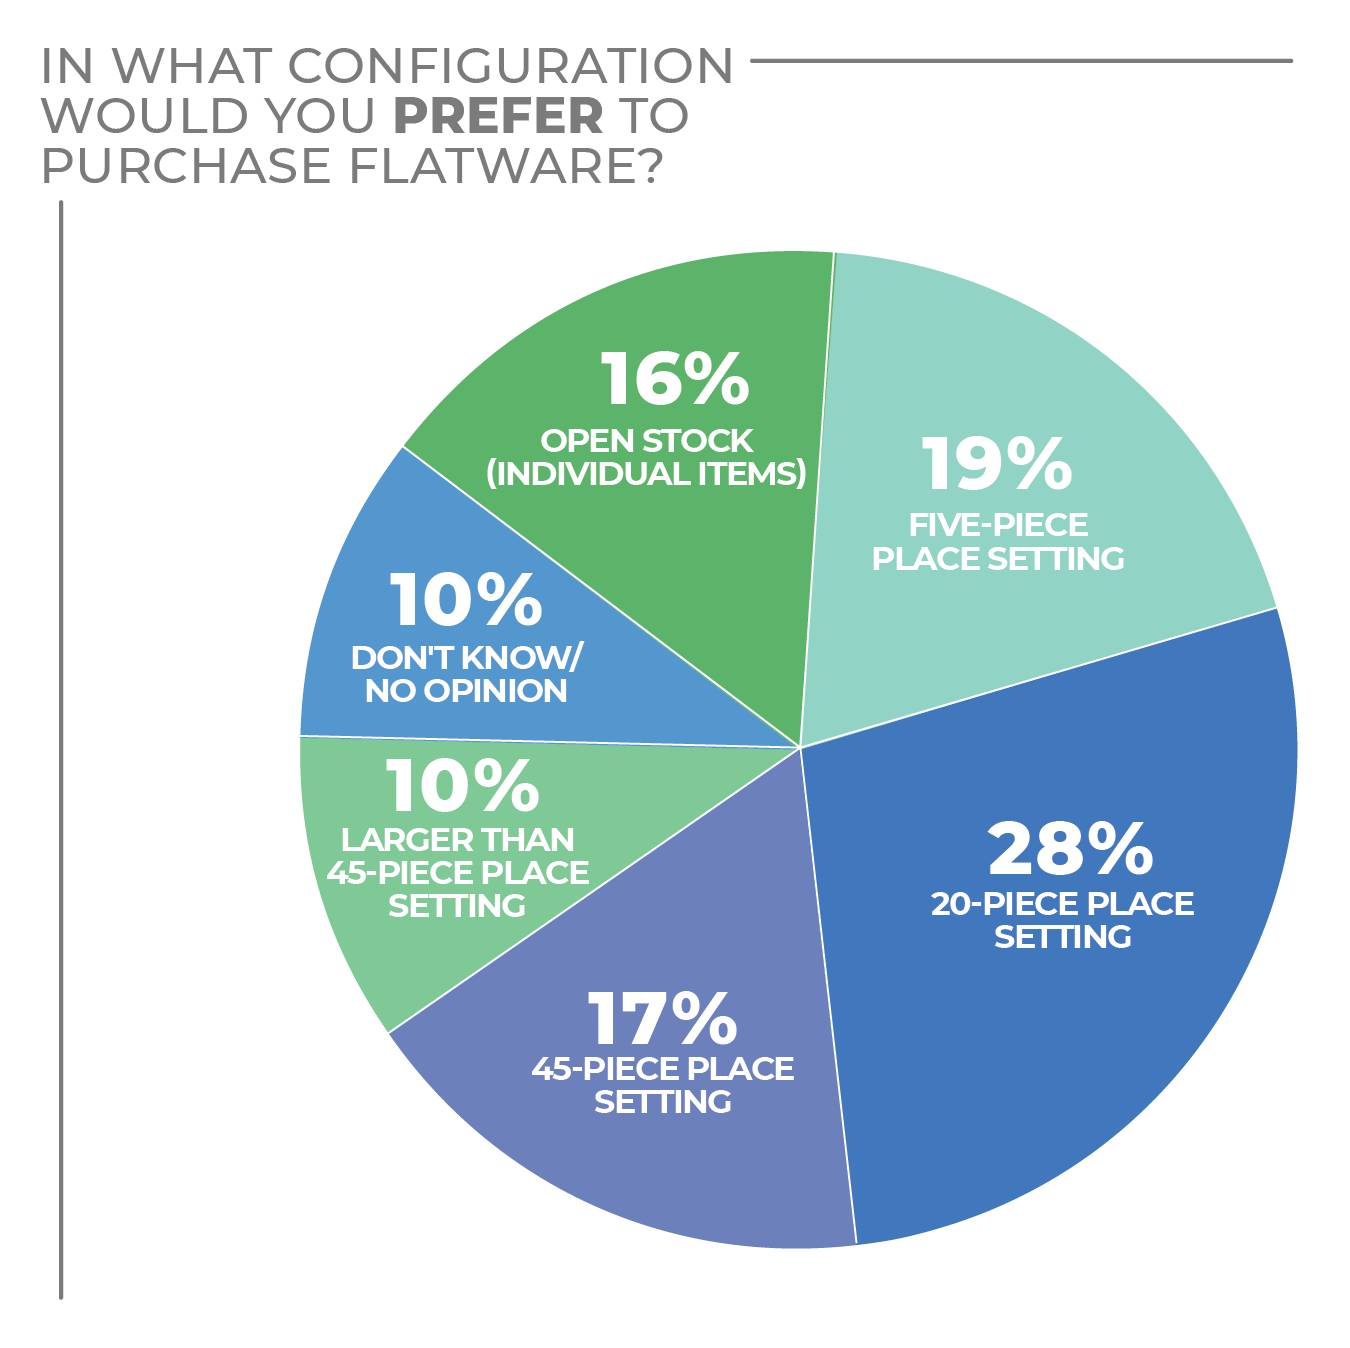
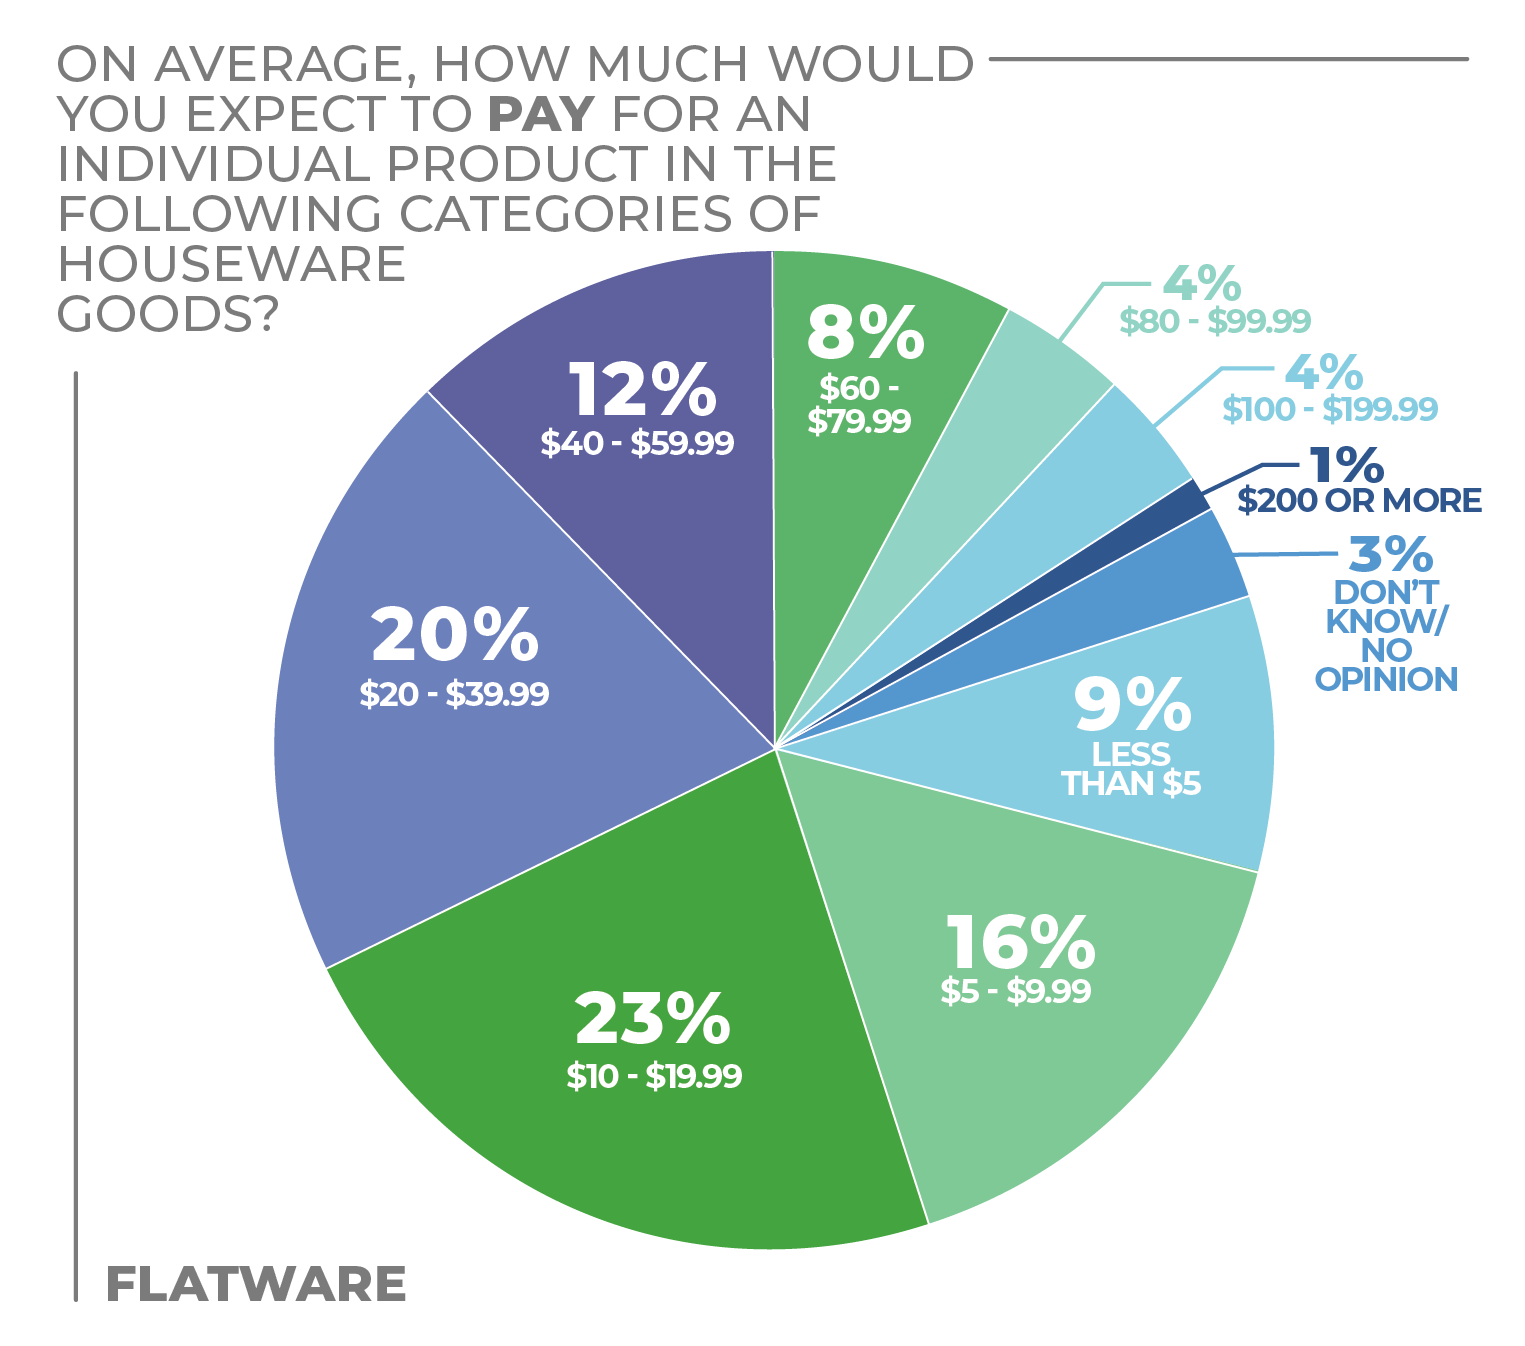
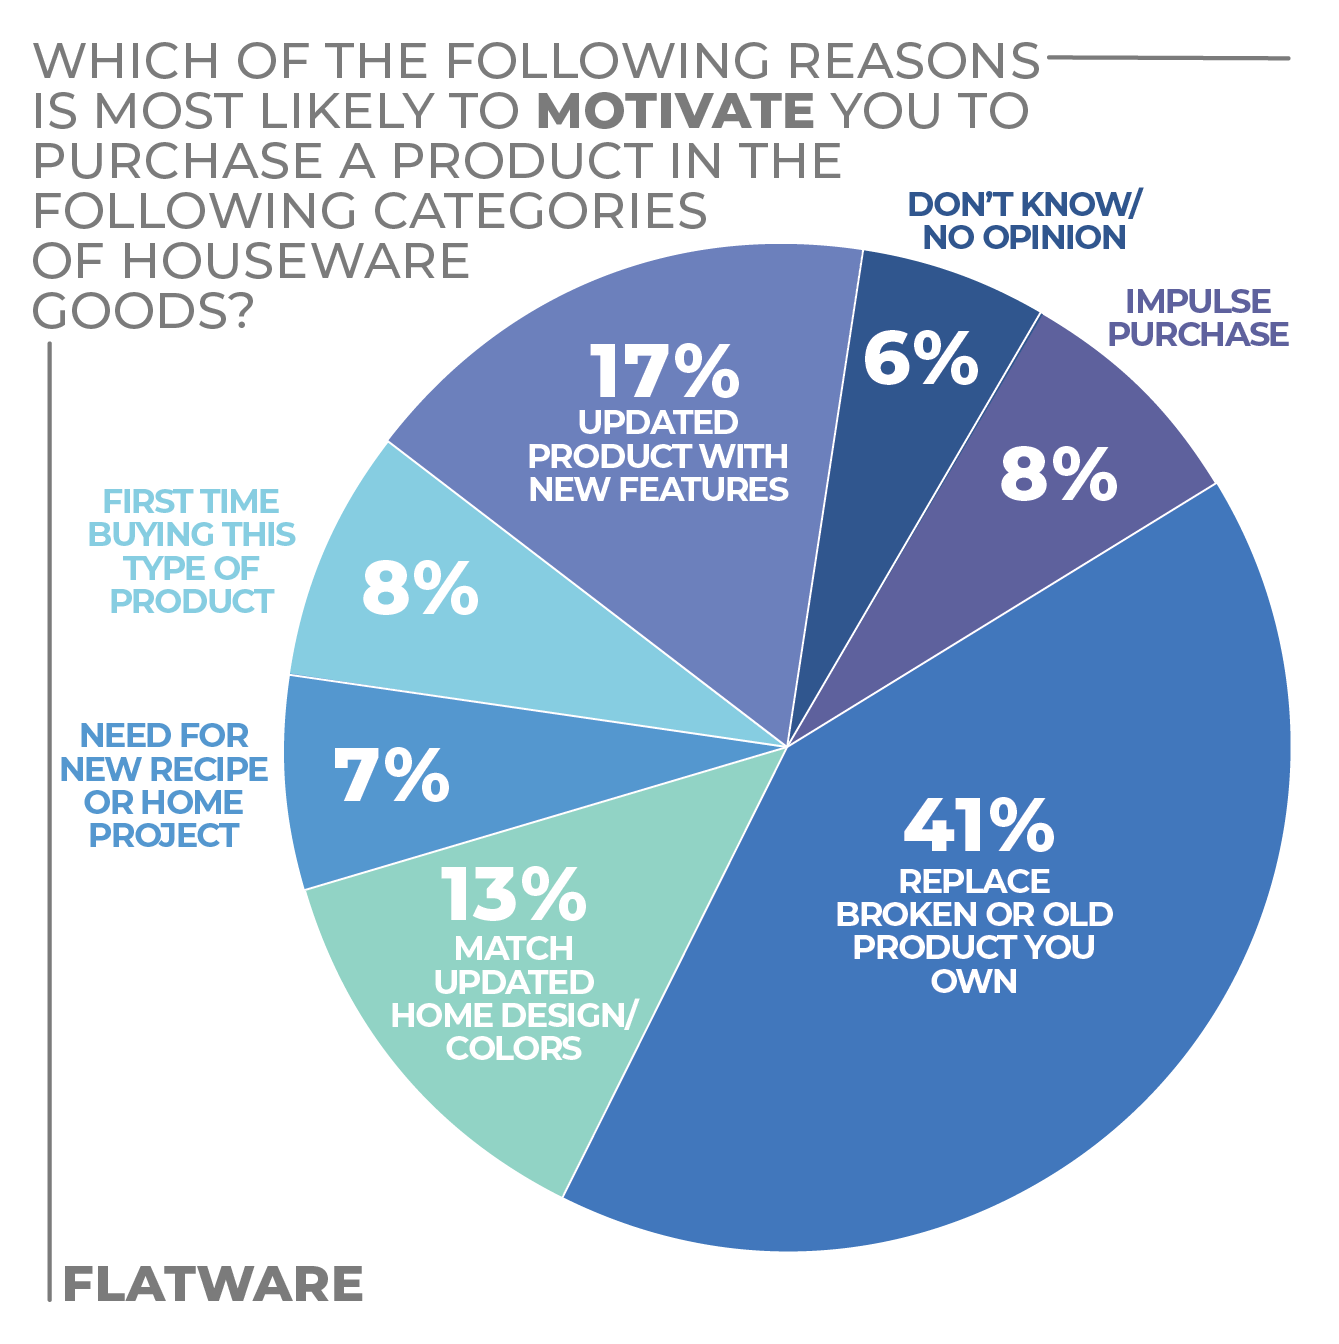
Flatware has typically been purchased in sets instead of open stock and replacement packs. Consumers continue to gravitate to the standard 20-piece place setting (selected by 28% of respondents), followed by a five-piece place setting (19%) and a 45-piece place setting (17%). The leading incentive to purchase flatware is replacing broken or old products, selected by 41% of respondents. That was followed by 17% stating they would make a purchase for a product with upgraded features and 13% stating they would purchase new flatware to match their home décor.
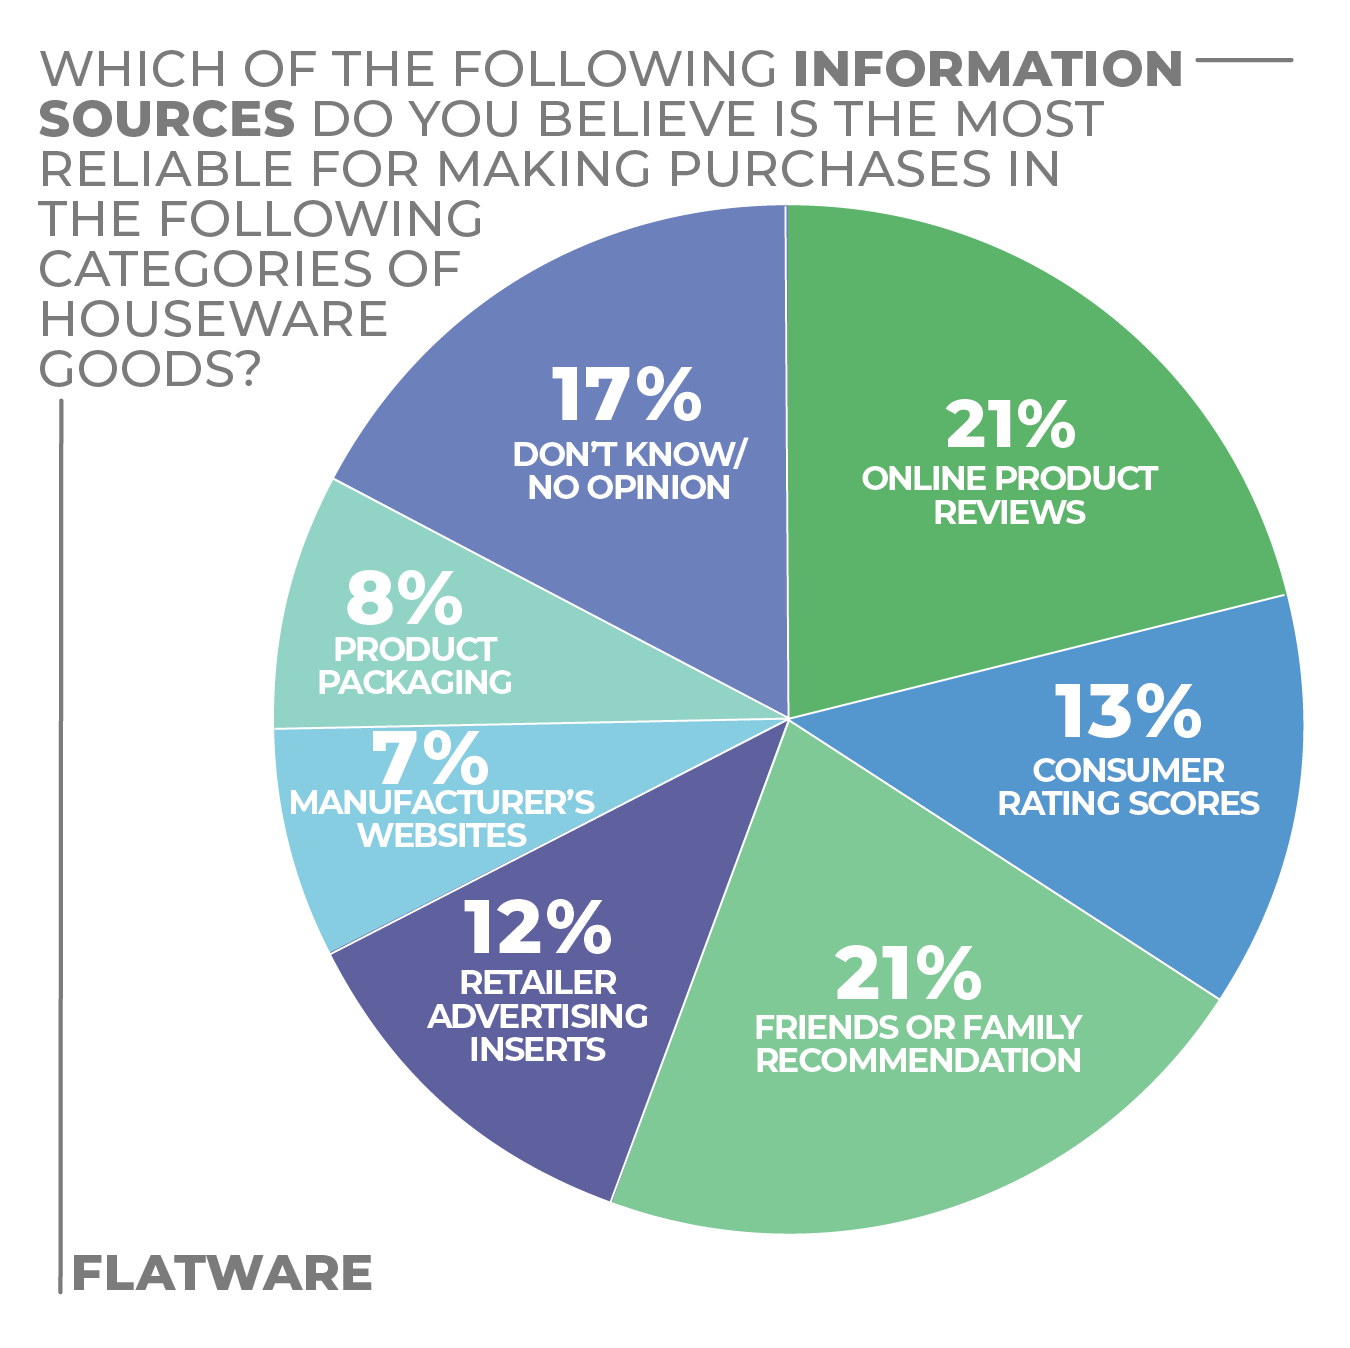
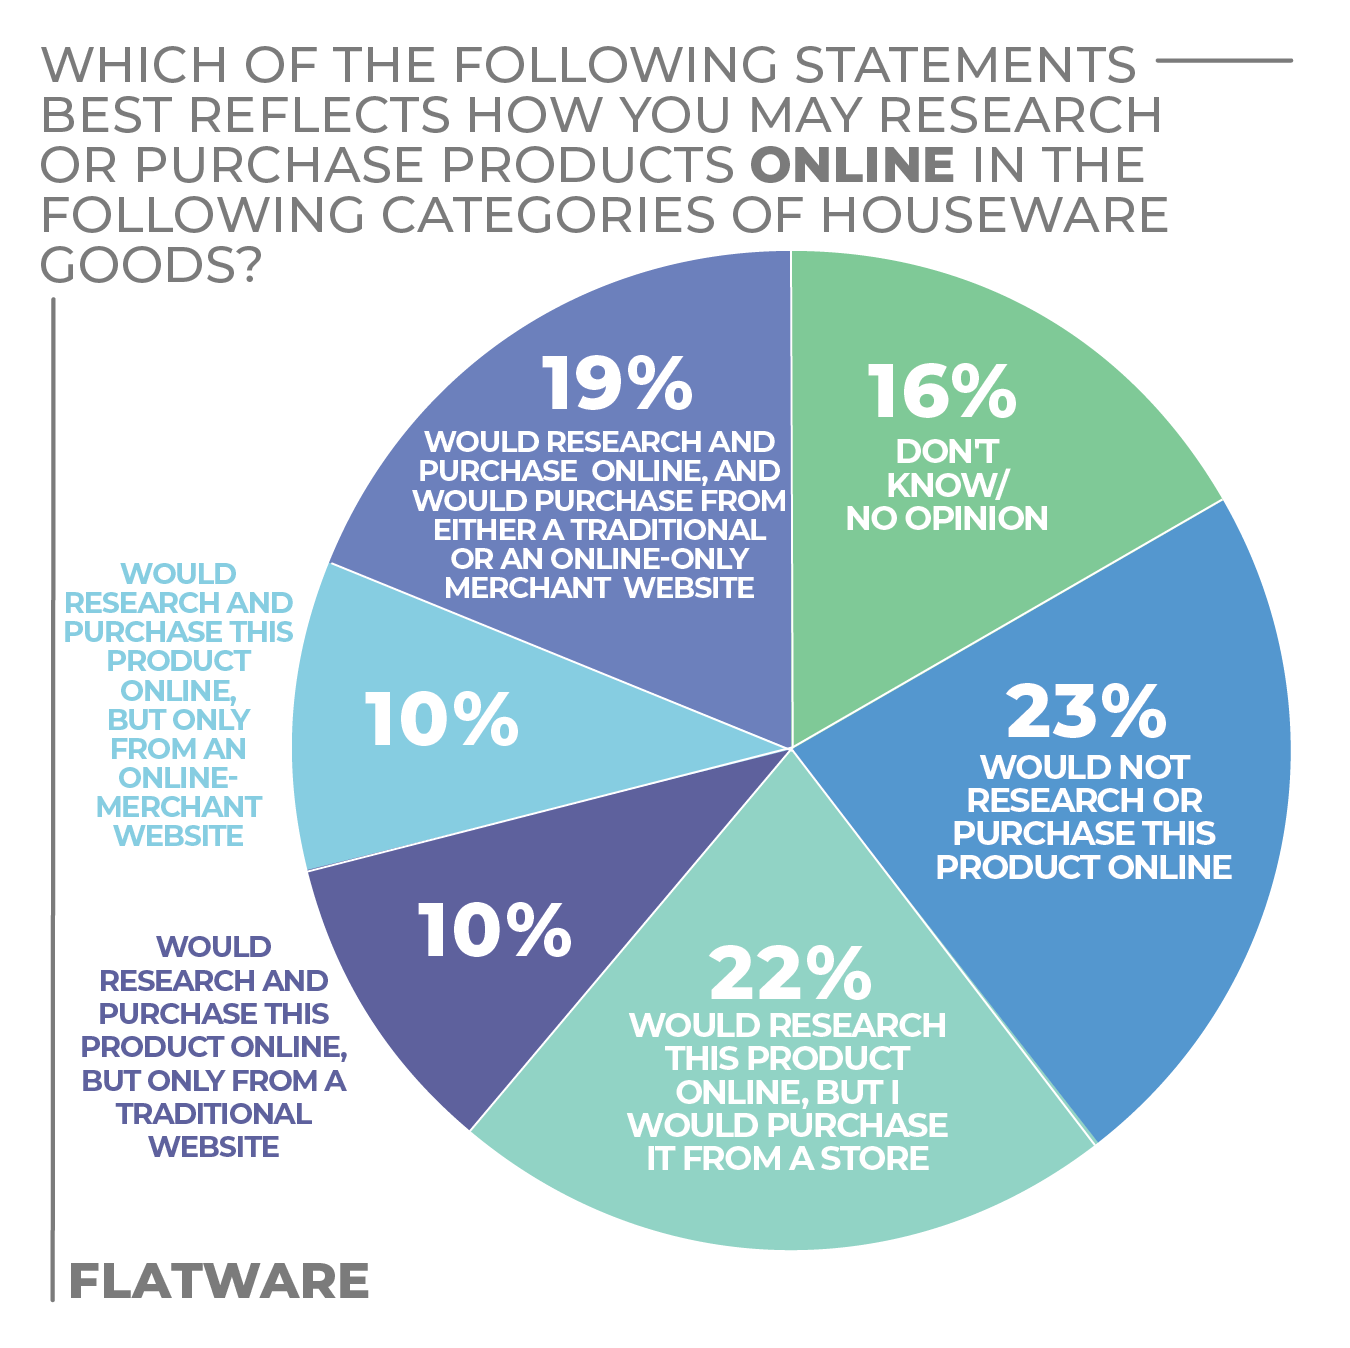
When making flatware purchasing decisions, survey respondents stated they rely most on online product reviews and recommendations from friends and family, both earning 21% of responses. While consumers are doing heavy online research, 22% prefer to purchase flatware in-person at a store (22%).
More Flatware Findings:
Click on charts to enlarge.

Drinkware
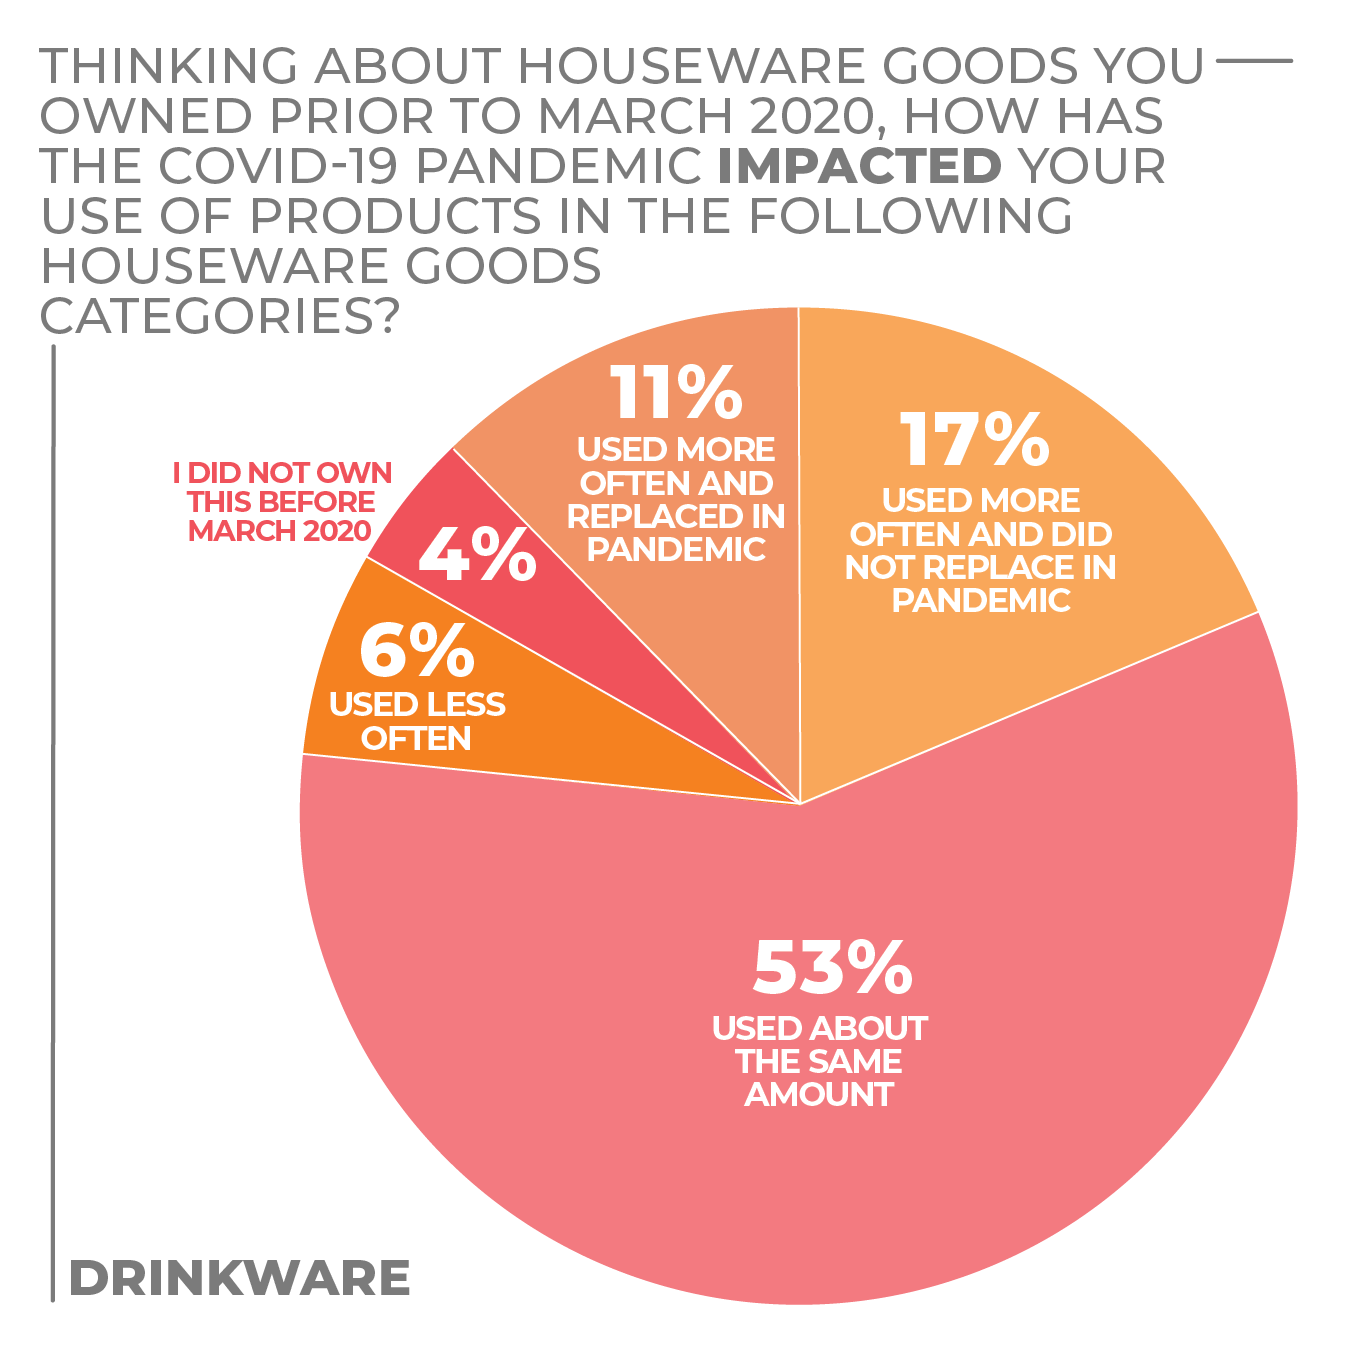
As consumer lifestyles became more hectic, portable drinkware became one of the most popular housewares categories. And it seems it will continue to grow in the coming year.
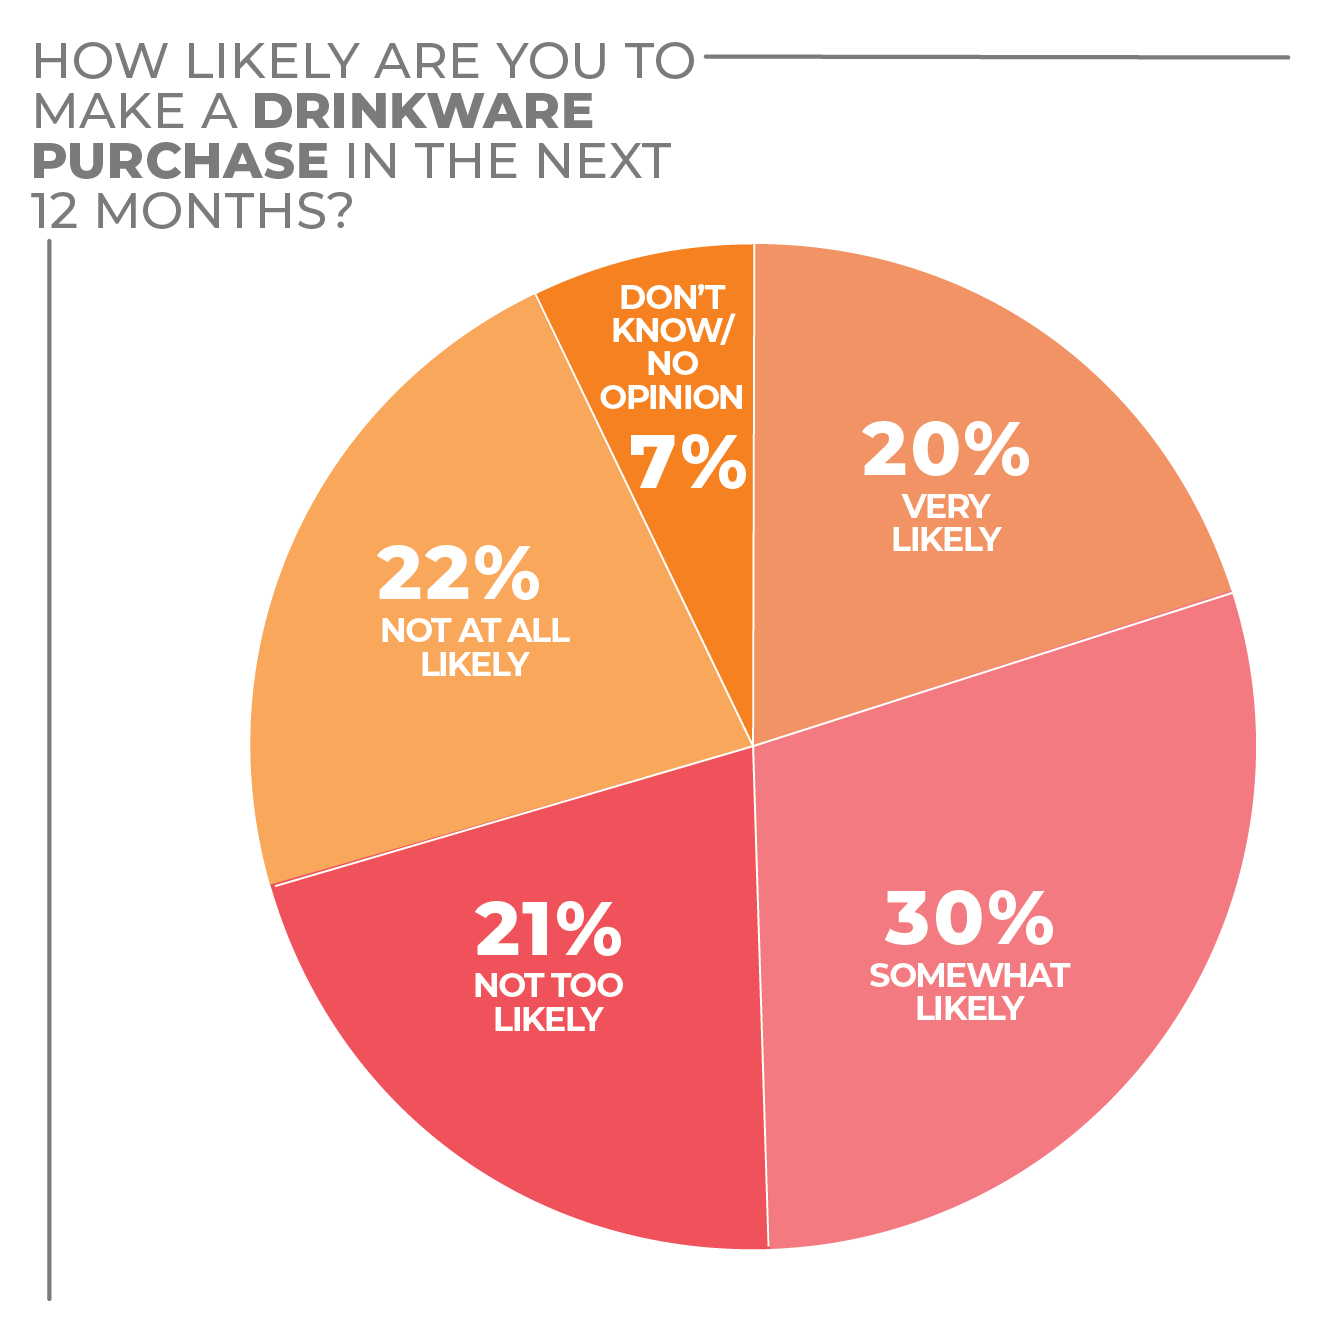
50% of consumers surveyed in the recent HomePage News 2022 Consumer Outlook Survey, stated they were somewhat or very likely to make a drinkware purchase in the next 12 months. And with the return (somewhat) to normalcy and consumers returning to work, school, daycare, the gym and other away-from-home activities, sales of portable drinkware solutions should continue to grow at a steady clip.
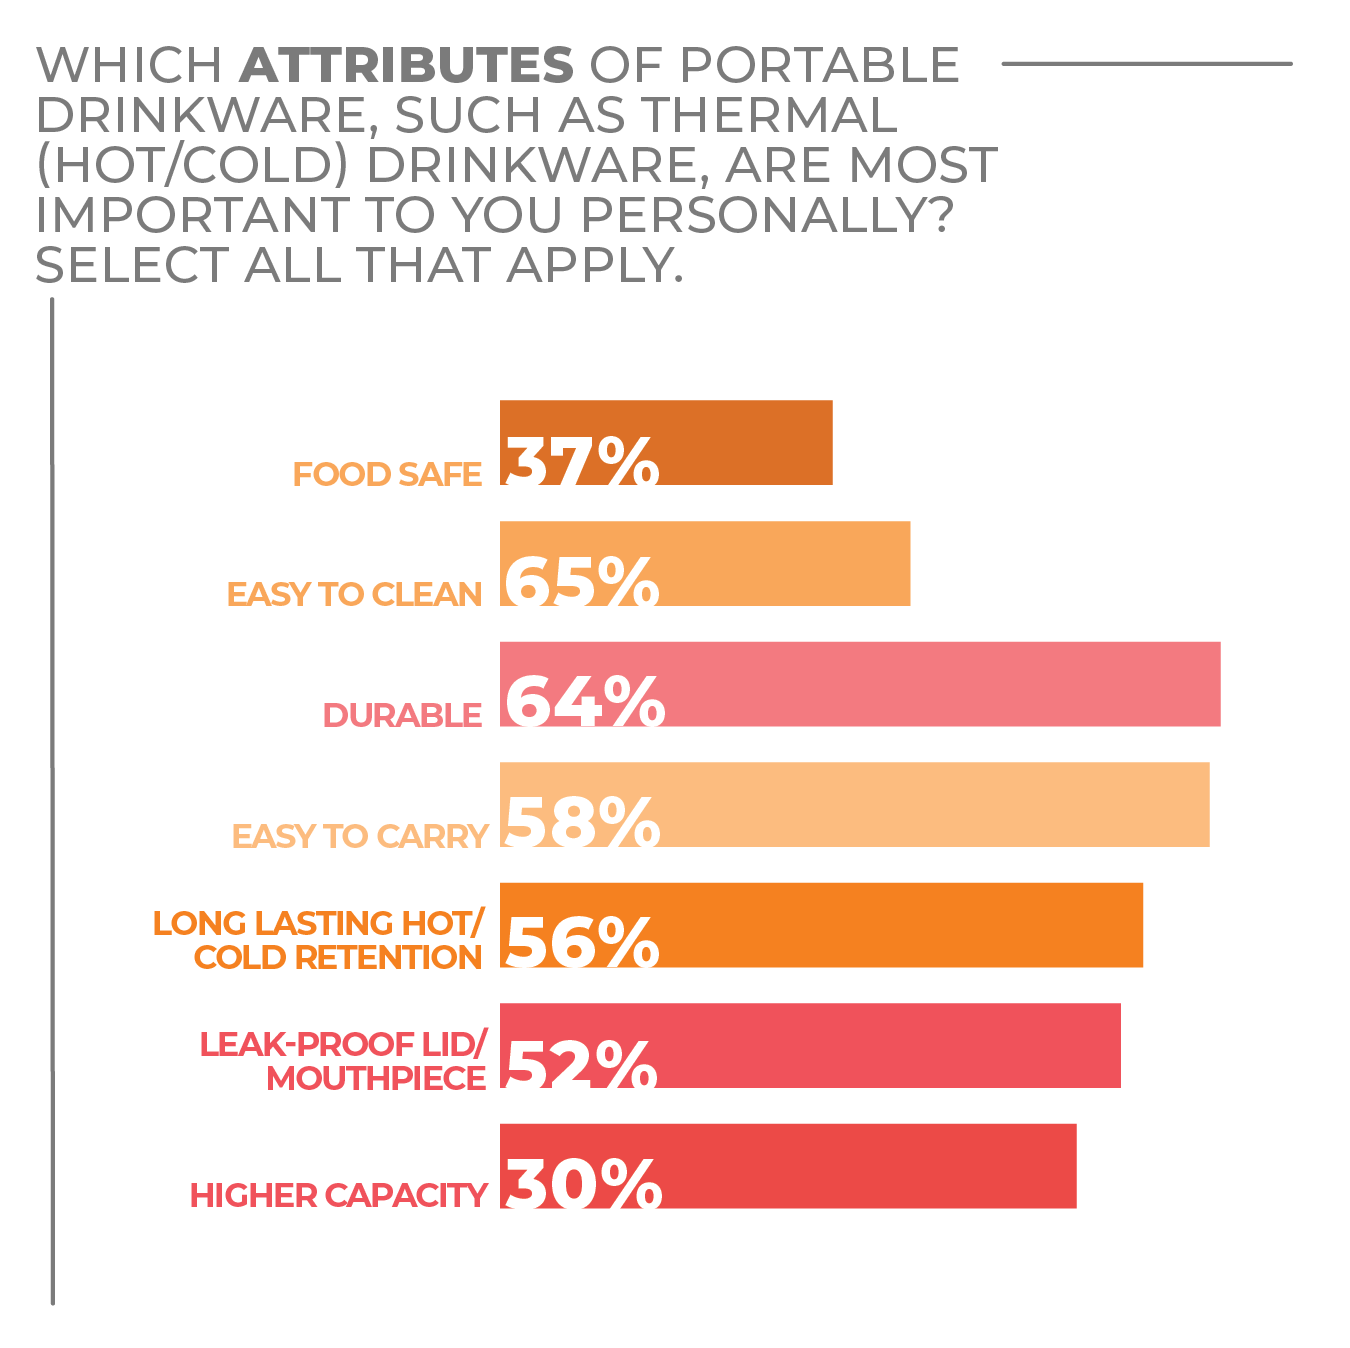
Consumers have honed in on the attributes they look for most when it comes to their thermal (hot/cold) on-the-go drinkware. Easy to clean (65%) and durability (64%) earned the most responses, closely followed by easy to carry (58%), long-lasting temperature retention (56%) and a leak-proof lid/mouthpiece (52%).
On-the-go beverageware has boomed the past decade, with so many choices entering the market. Insulated drinkware is an extension of daily living habits, keeping morning coffee and tea hot and smoothies and juices cold while commuting, driving to school, running daily errands and even escaping to a home office.
Consumer price expectations for portable drinkware are shifting to reflect higher demand for quality. Consumers today are willing to spend more on higher-performance drinkware.
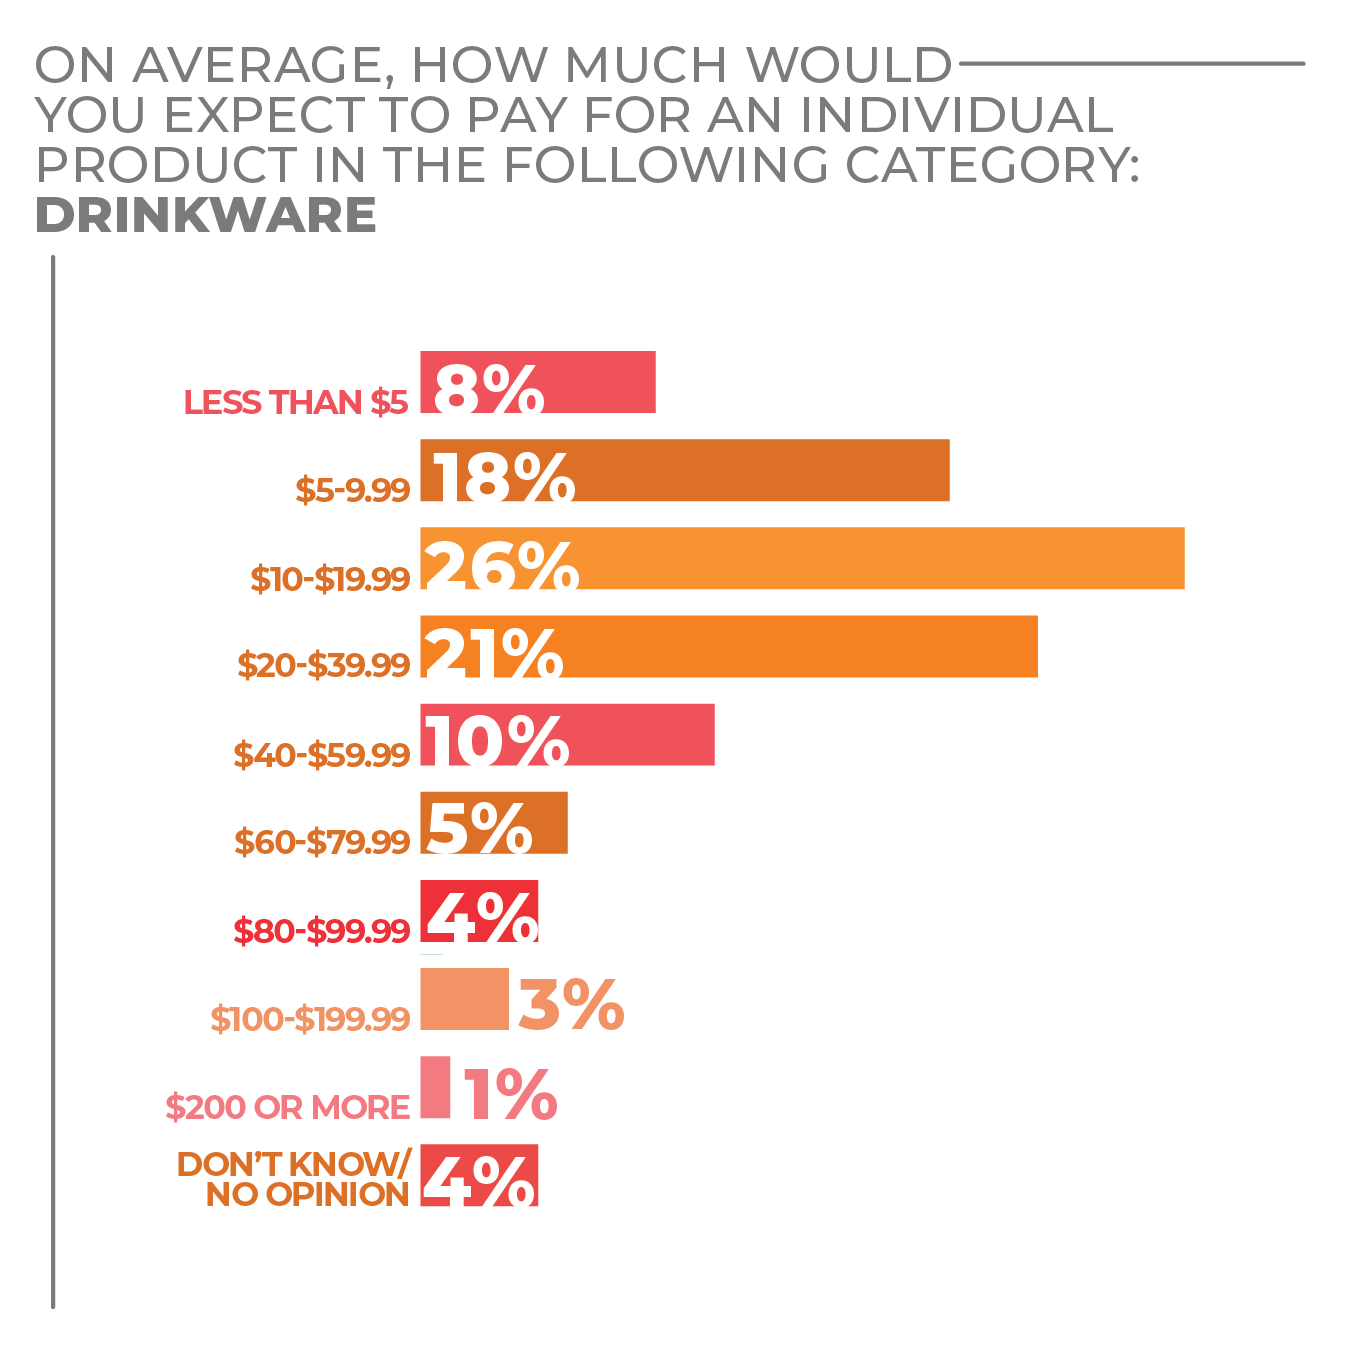
According to the survey, respondents stated they expected to pay more for beverageware across the board. Most (47%) prefer to spend between $10-$39.99, with 10% willing to spend $40-$59.99.
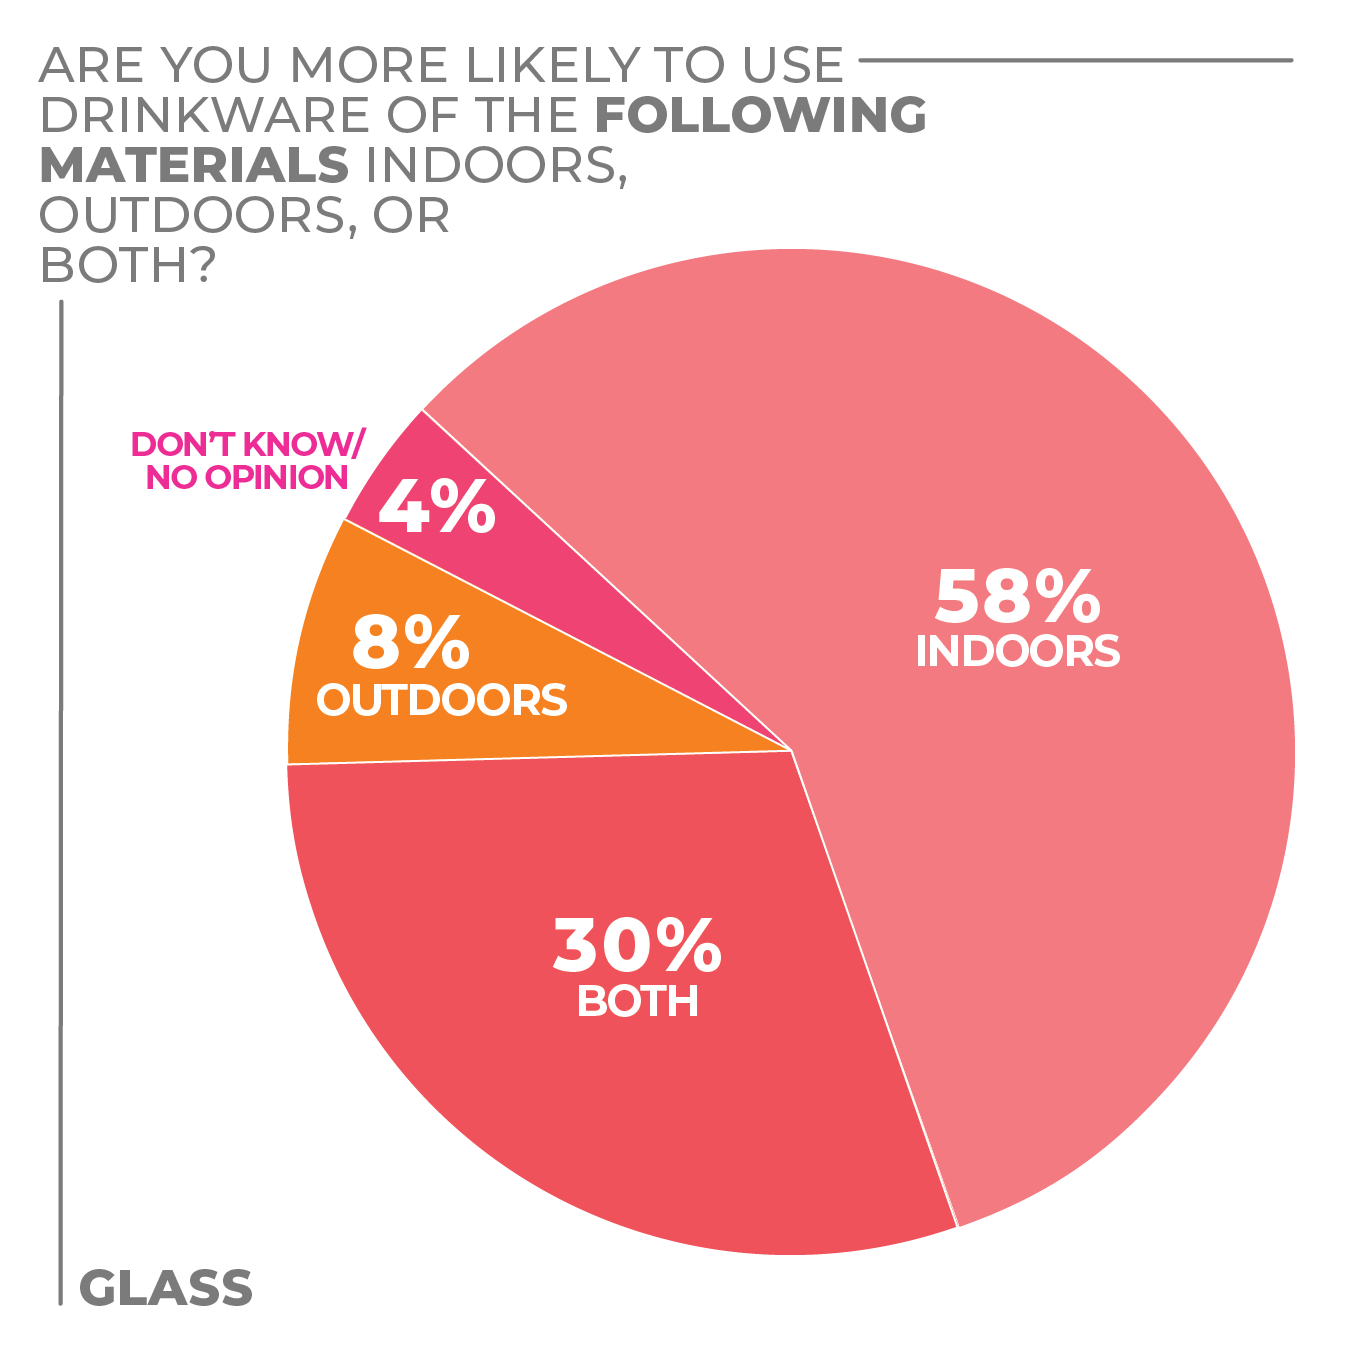
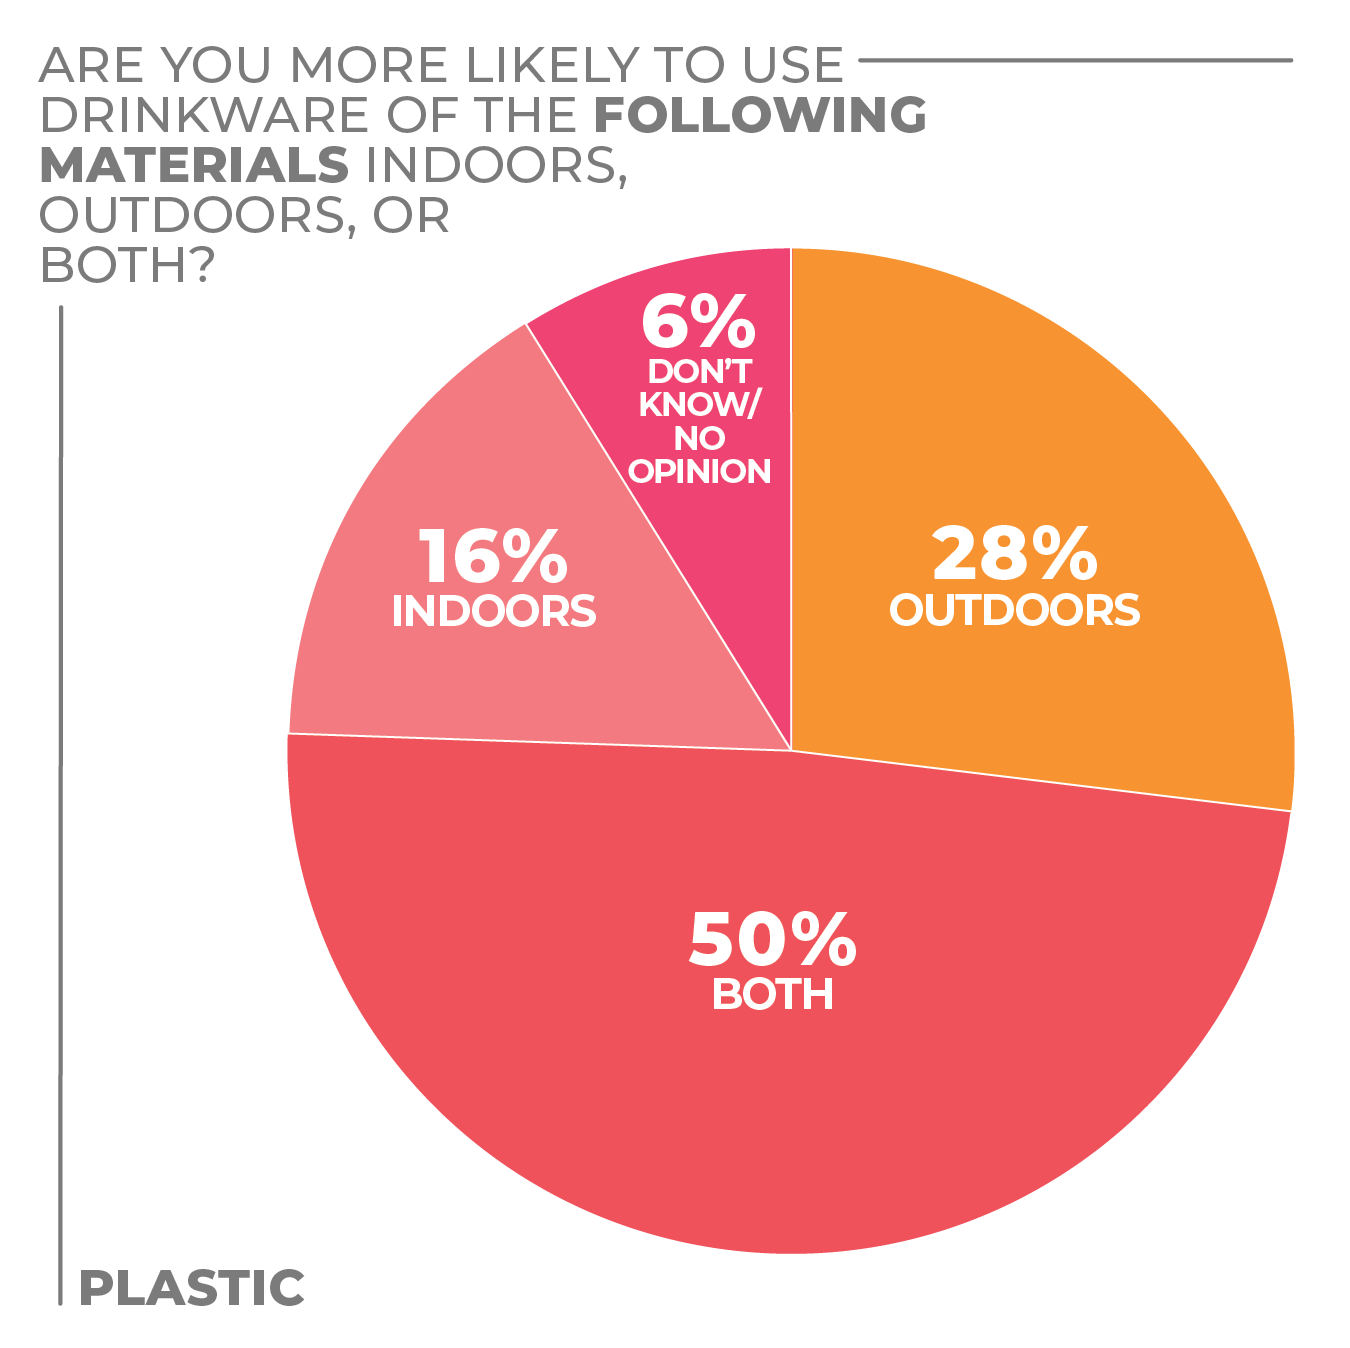
In addition to portable drinkware, consumers are paying closer attention to new drinkware options in the home, welcoming more plastic/acrylic drinkware to be used outdoors as backyard entertaining activity increases. Some 50% of respondents said they used their plastic/acrylic drinkware indoors and outdoors. A somewhat surprising 30% stated they use their glassware indoors and outdoors.
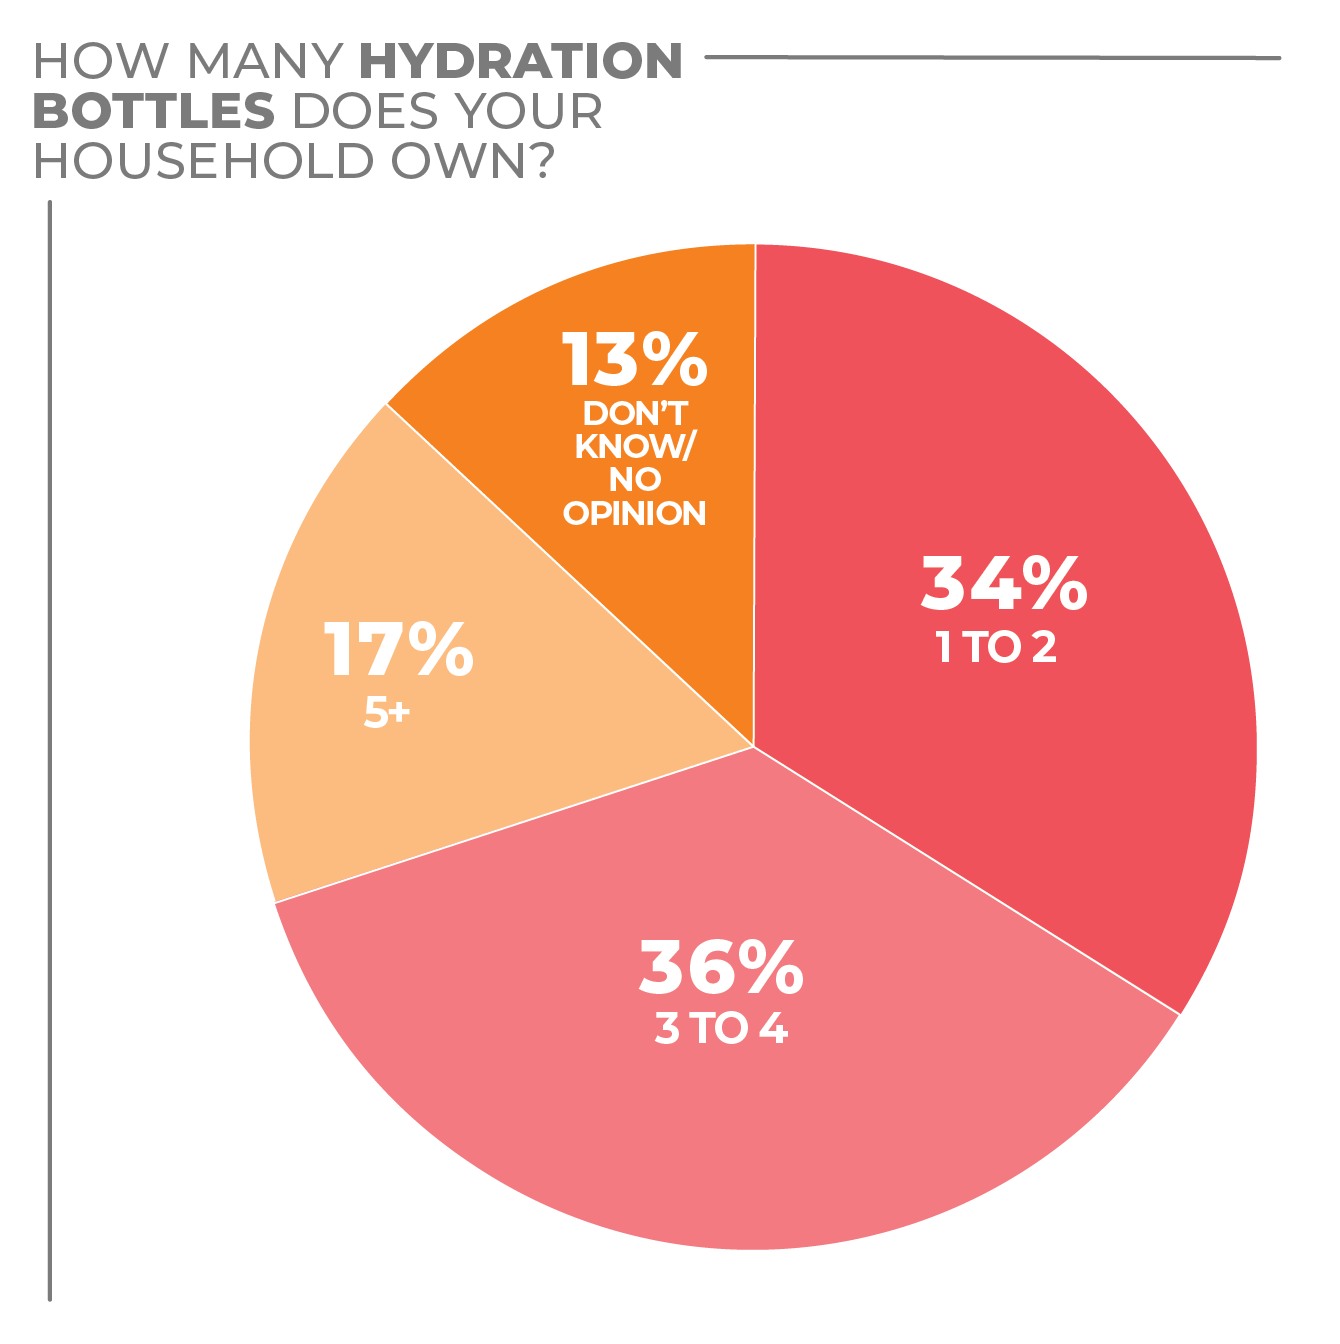
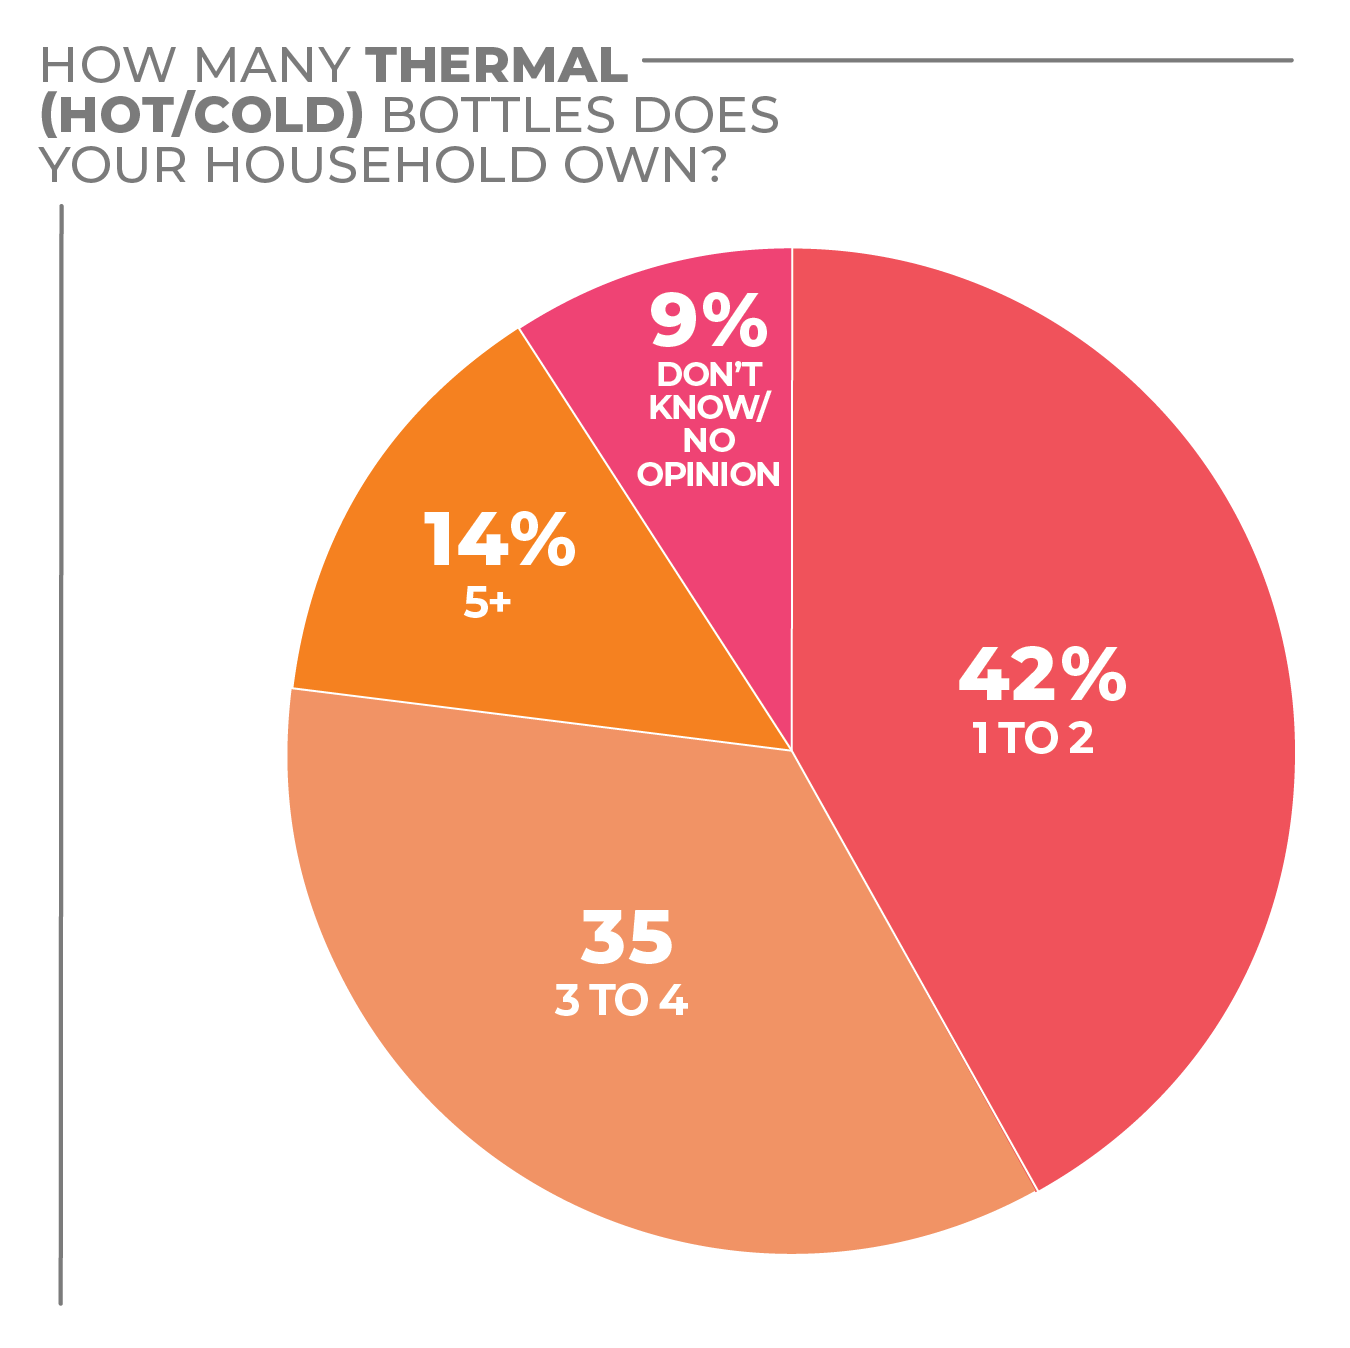
As portable beverageware continues to trend, the majority of survey respondents reported having up to four hydration (70%) and thermal (hot/cold) bottles (77%) at home, with 17% stating they have five or more hydration bottles and 14% having more than five thermal bottles at home.
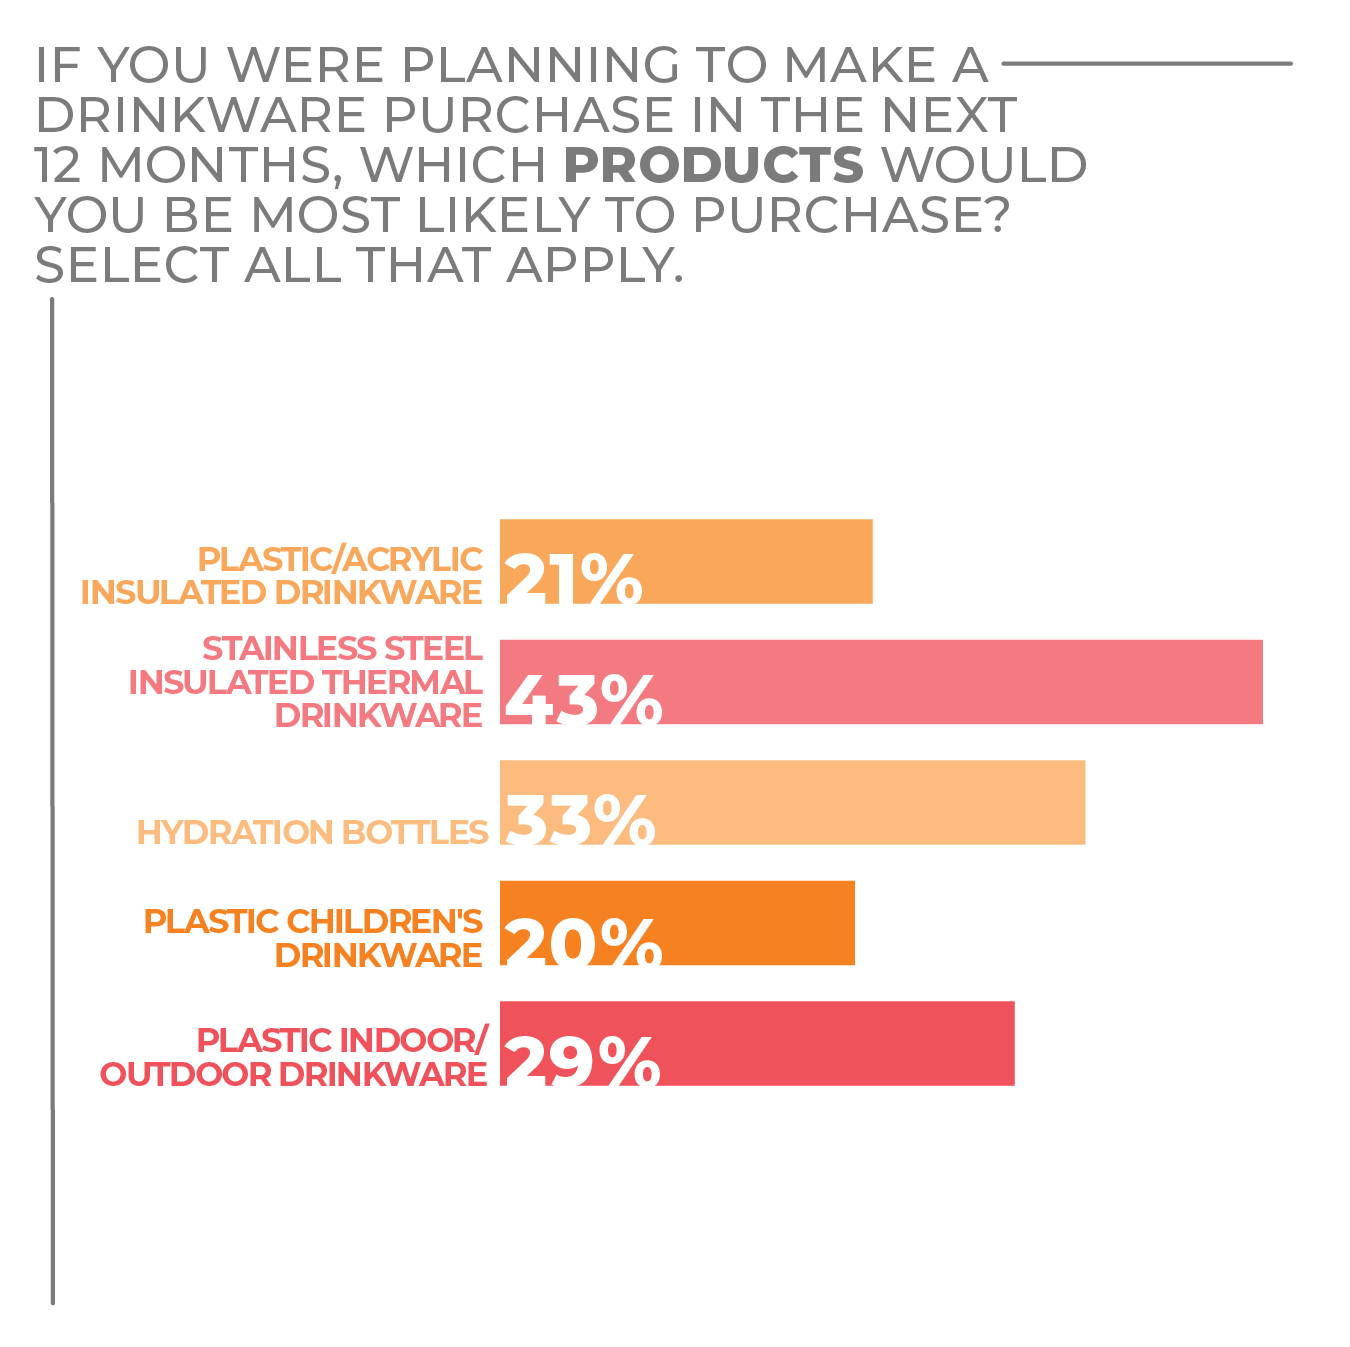
Stainless steel portable drinkware remains popular, with 43% of respondents selecting it as the drinkware purchase they were most likely to make in the coming months, followed by hydration bottles (33%).
More Drinkware Findings:
Click on charts to enlarge.

Floor Care Electrics
The floor care electrics category has felt the effects of COVID-19 with consumers spending more time at home, but the category had been changing substantially before March 2020.
For many years, consumers have been rethinking carpeting and many now favor hard floors. The trend involves multiple factors. As the United States population shifted south and west, having carpet to keep the chill off feet became less important, and better insulation has had a similar influence in colder parts of the country. The introduction of indoor/outdoor spaces was also a factor. In that case, tile and other outdoor floorings can run right into a transitional space, so hard flooring made more sense as consumers tramping in and out of the home track in dirt that can be hard to get out of carpets.
At the same time, new hard flooring products emerged that could be installed by non-professionals and the growing class of do-it-yourselfers.
The American affinity for pets, which became even more prominent in the pandemic, also encouraged hard flooring that is easier to deal with pet messes.
These changes became a cleaning consideration that cut both ways. Many people prefer carpeting, which in combination with pets, prompted the development of floor care electrics designed with features to deal with the cleaning challenges animals create. Consequently, change in the floor care electrics category was driven by innovation that addressed a lifestyle need, not just as the response to outside influences.
Robotic vacuums arose from internal industry innovation. And as their pricing became accessible to more consumers, represented a creative solution to lifestyle needs that have proven attractive to a substantial proportion of shoppers.
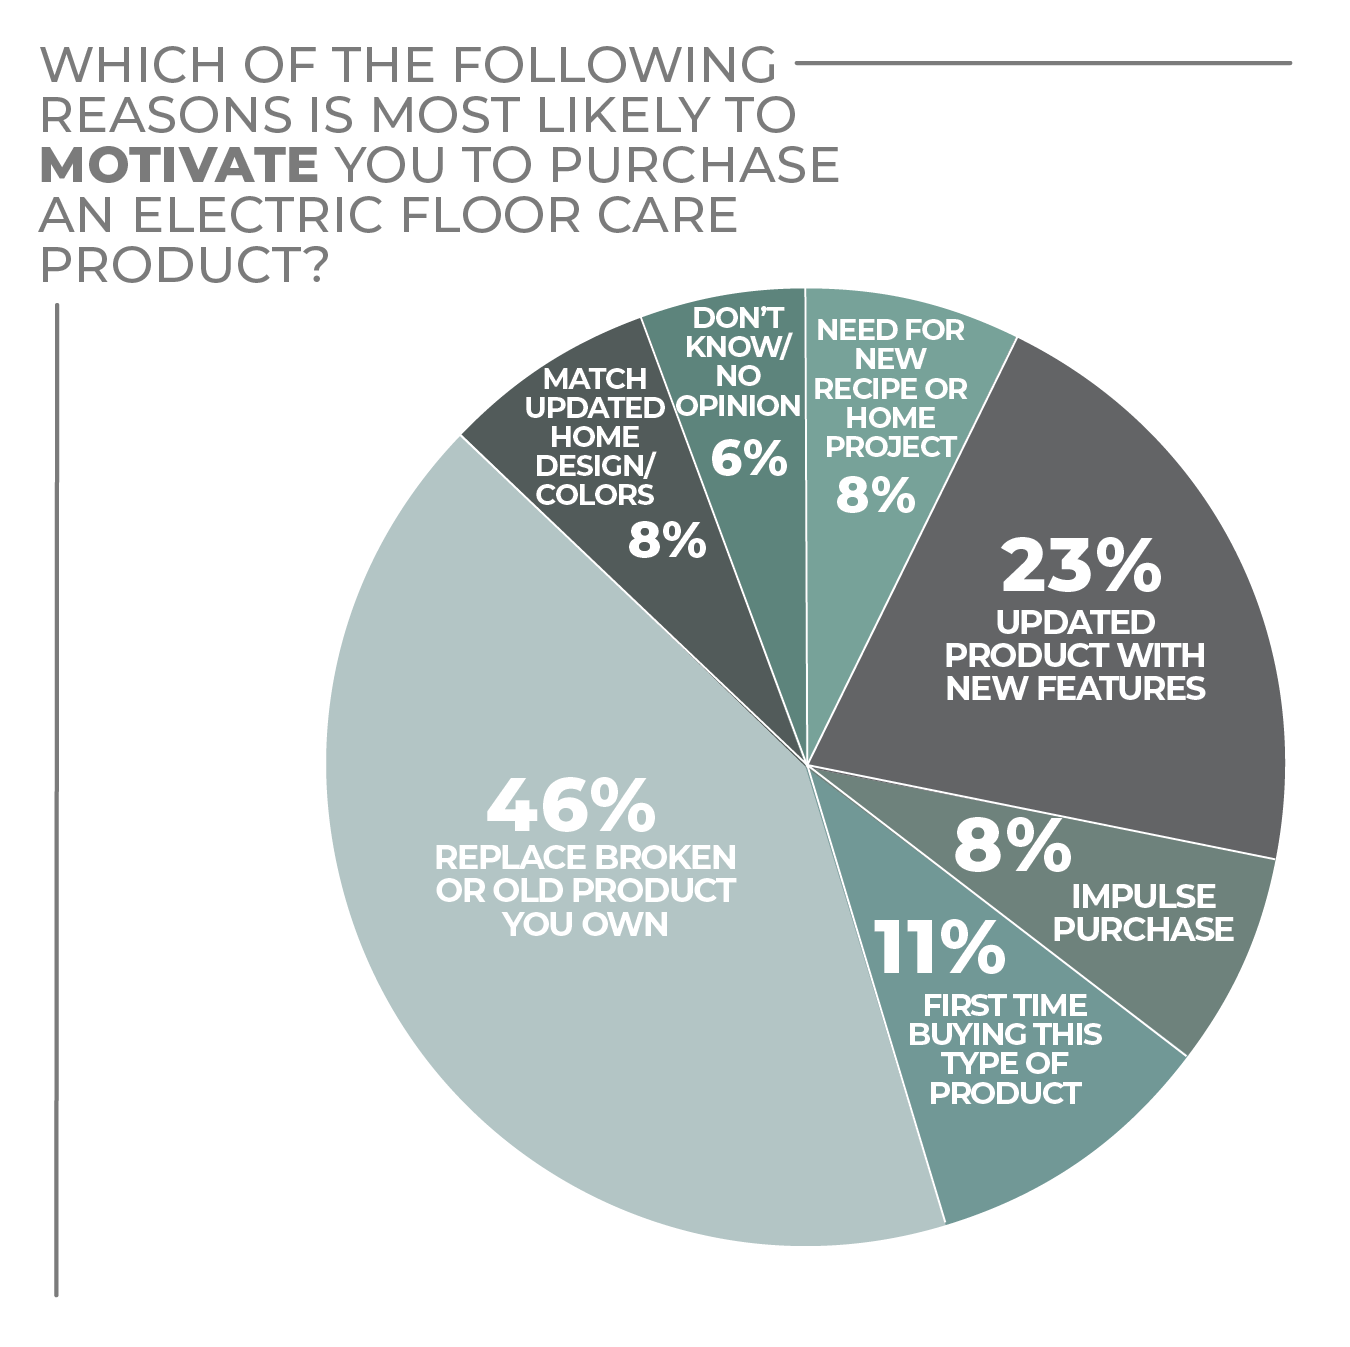
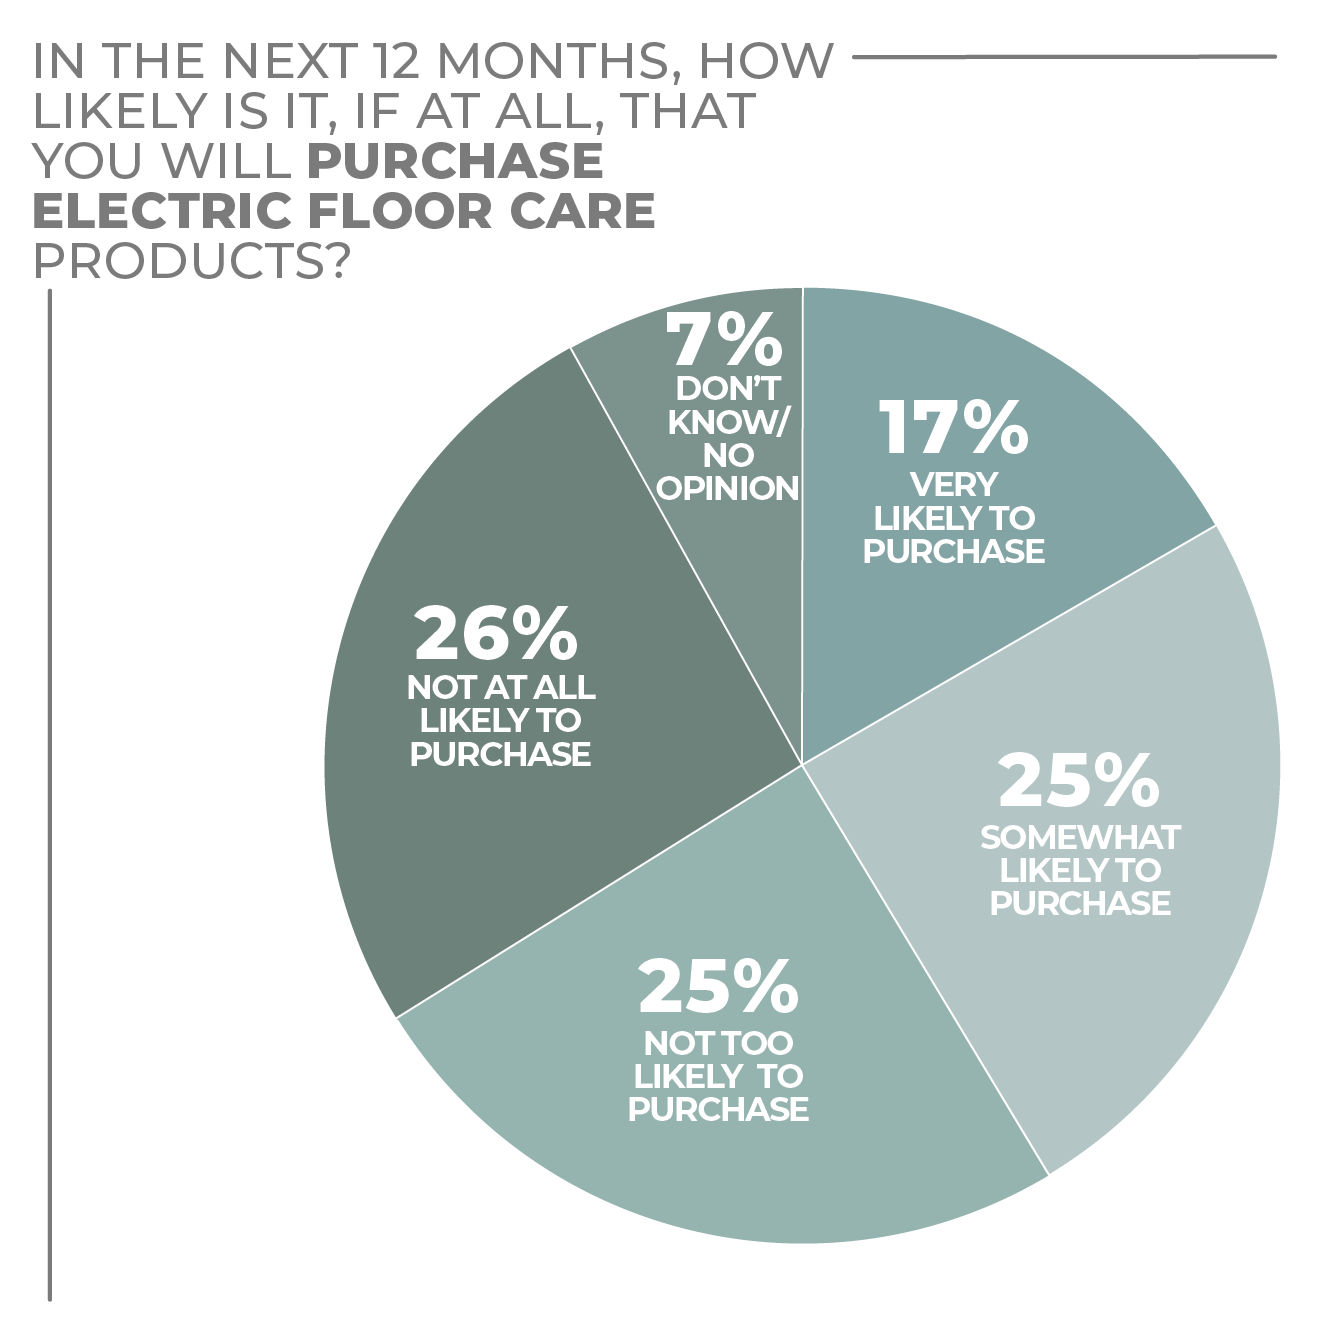
Although consumers aren’t ready to rush out en masse to purchase electric floor care products, according to the HomePage News 2022 Consumer Outlook Survey results, 17% of respondents reported they were very likely to purchase while 25% said they were somewhat likely to purchase.
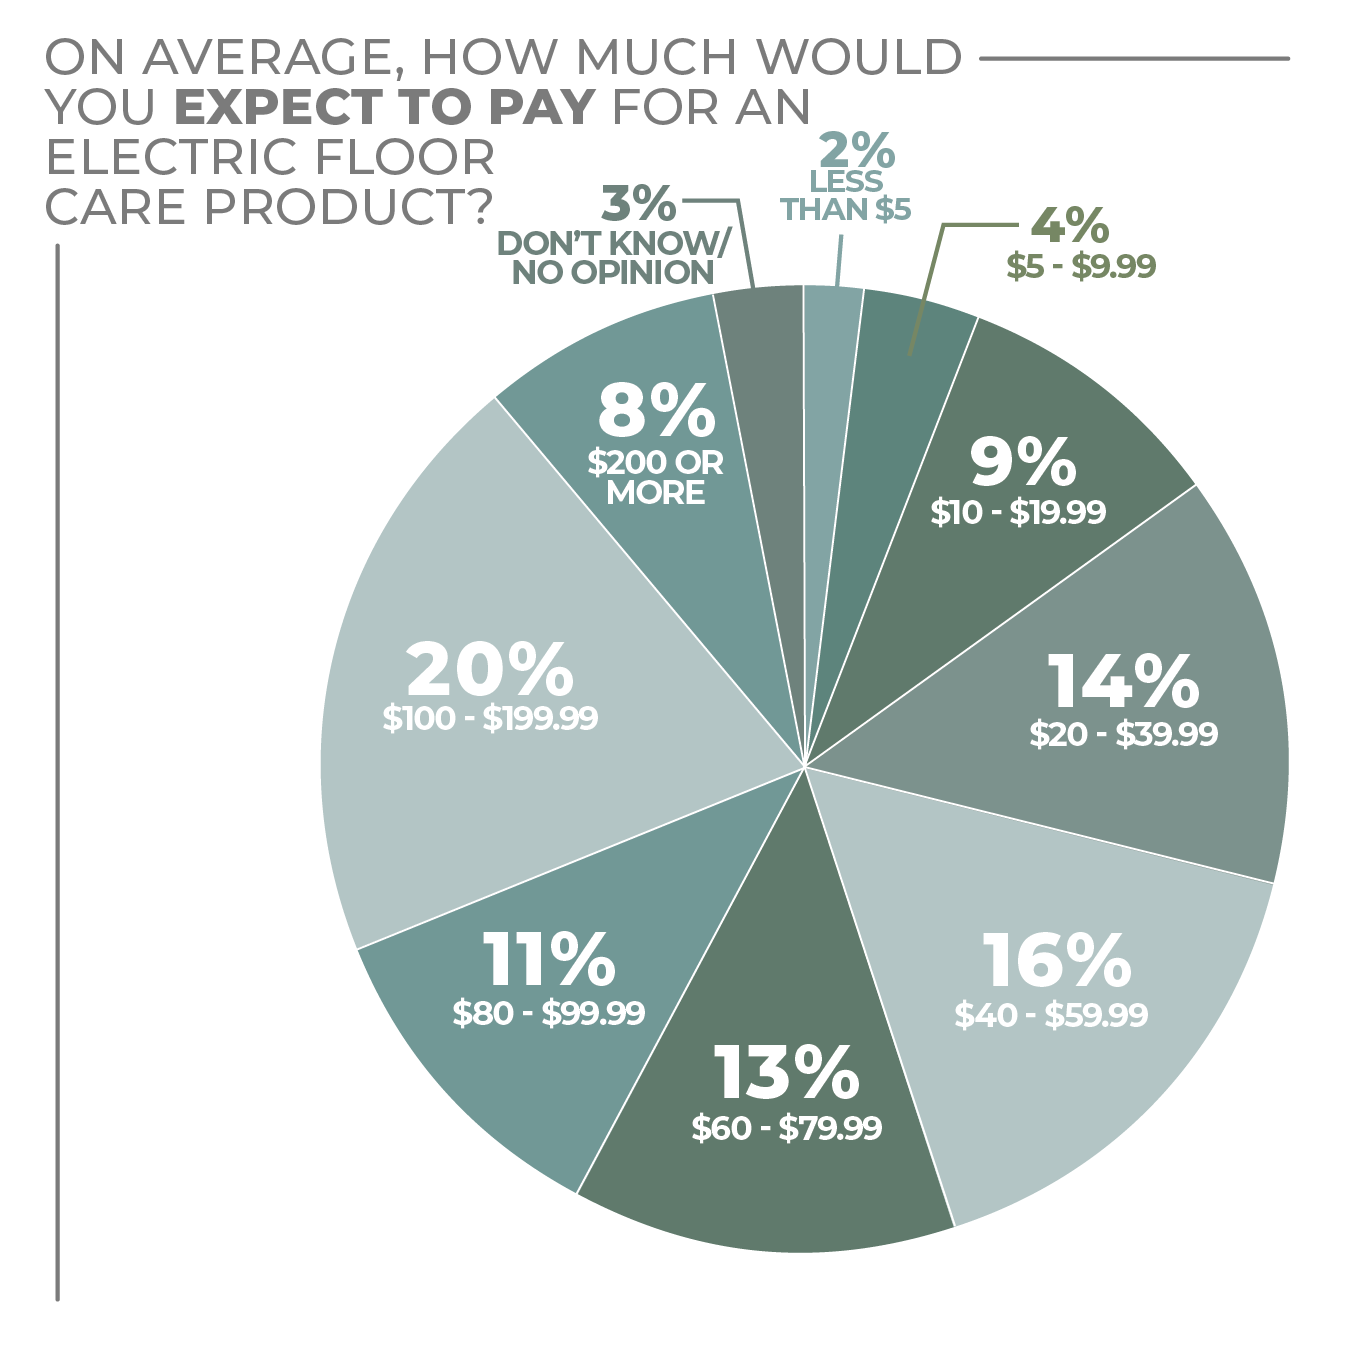
Although replacement was reported to be the biggest reason to purchase an electric floor care product at 36%, the combination of consumers buying their first product (11%) and who admit being enticed by new features (23%) represents more than a third of respondents. This suggests some shoppers are waiting to be sold.
The survey indicated consumers were not driven by the pandemic to purchase more often, a designation that only represents 10% of respondents compared to 14% who stated that they purchased less often.
However, it should be taken into consideration that many consumers could have updated their electric floor care products earlier in conjunction with their housing and flooring circumstances.
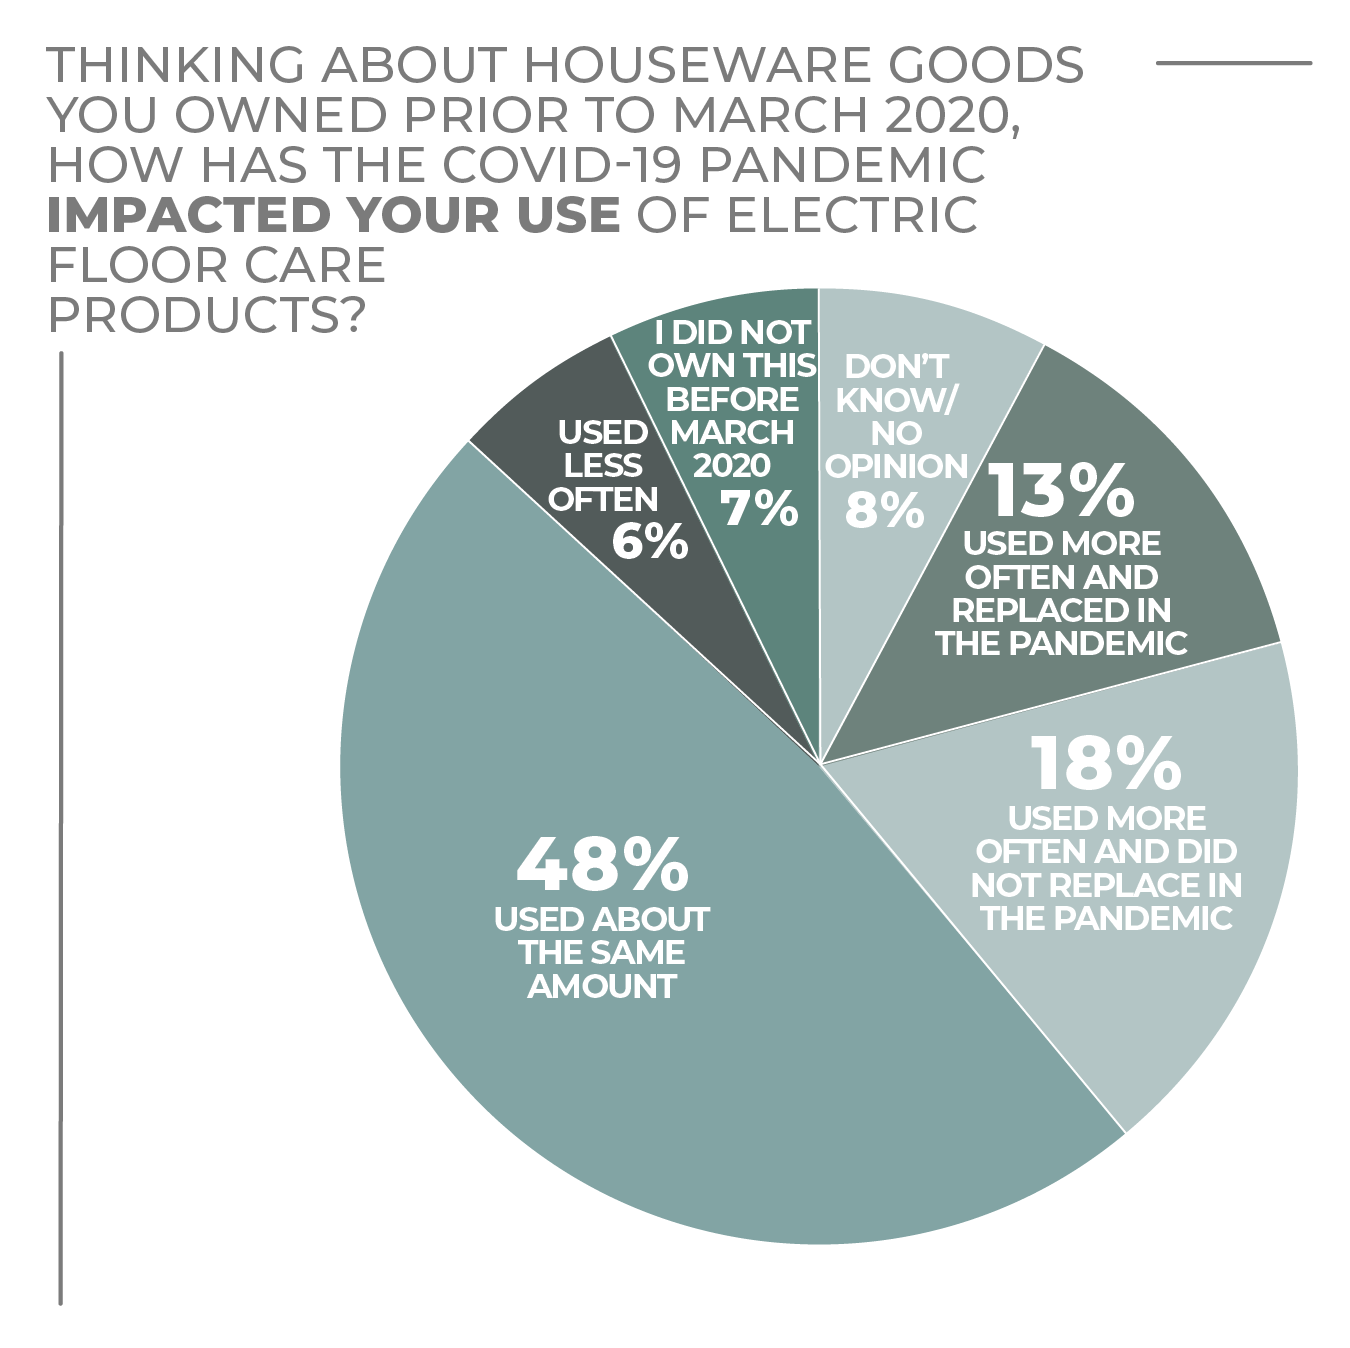
Interestingly, 13% of consumers reported that they used their electric floor care products more often during the pandemic and replaced them, while 18% said they used their electric floor care products more often and didn’t replace them. Some 48% used the floor care electrics about the same amount.
The numbers hint that buying intention is relatively low, but replacement, the biggest purchase factor, will be a necessity before too long.
Urban dwellers were the group most interested in purchasing in the floor care electrics category, with 24% saying they are very likely and 27% saying they were somewhat likely to purchase, beating suburban and rural retailers in both designations. Not surprisingly, as people shift into bigger spaces, Millennials are the top generational echelon considering an electric floor care product purchase, with 28% very and 30% somewhat likely to buy.
The consumers with the highest incomes, households with more than $100,000 in cash coming in each year, are ready to purchase, with 28% very likely and 32% somewhat likely to buy. As for geography, consumers in the Northeast and Midwest are in a virtual tie in their purchasing enthusiasm, while those in the Midwest and South lag somewhat.
More Floor Care Electrics Findings:
Click on charts to enlarge.

Glassware
The glassware category, buoyed by increased interest in home entertaining and sharing cocktail creations on social media, has had a healthy run the past few years. The trend continues as manufacturers continue to offer up new shapes, designs and uses for their glassware.
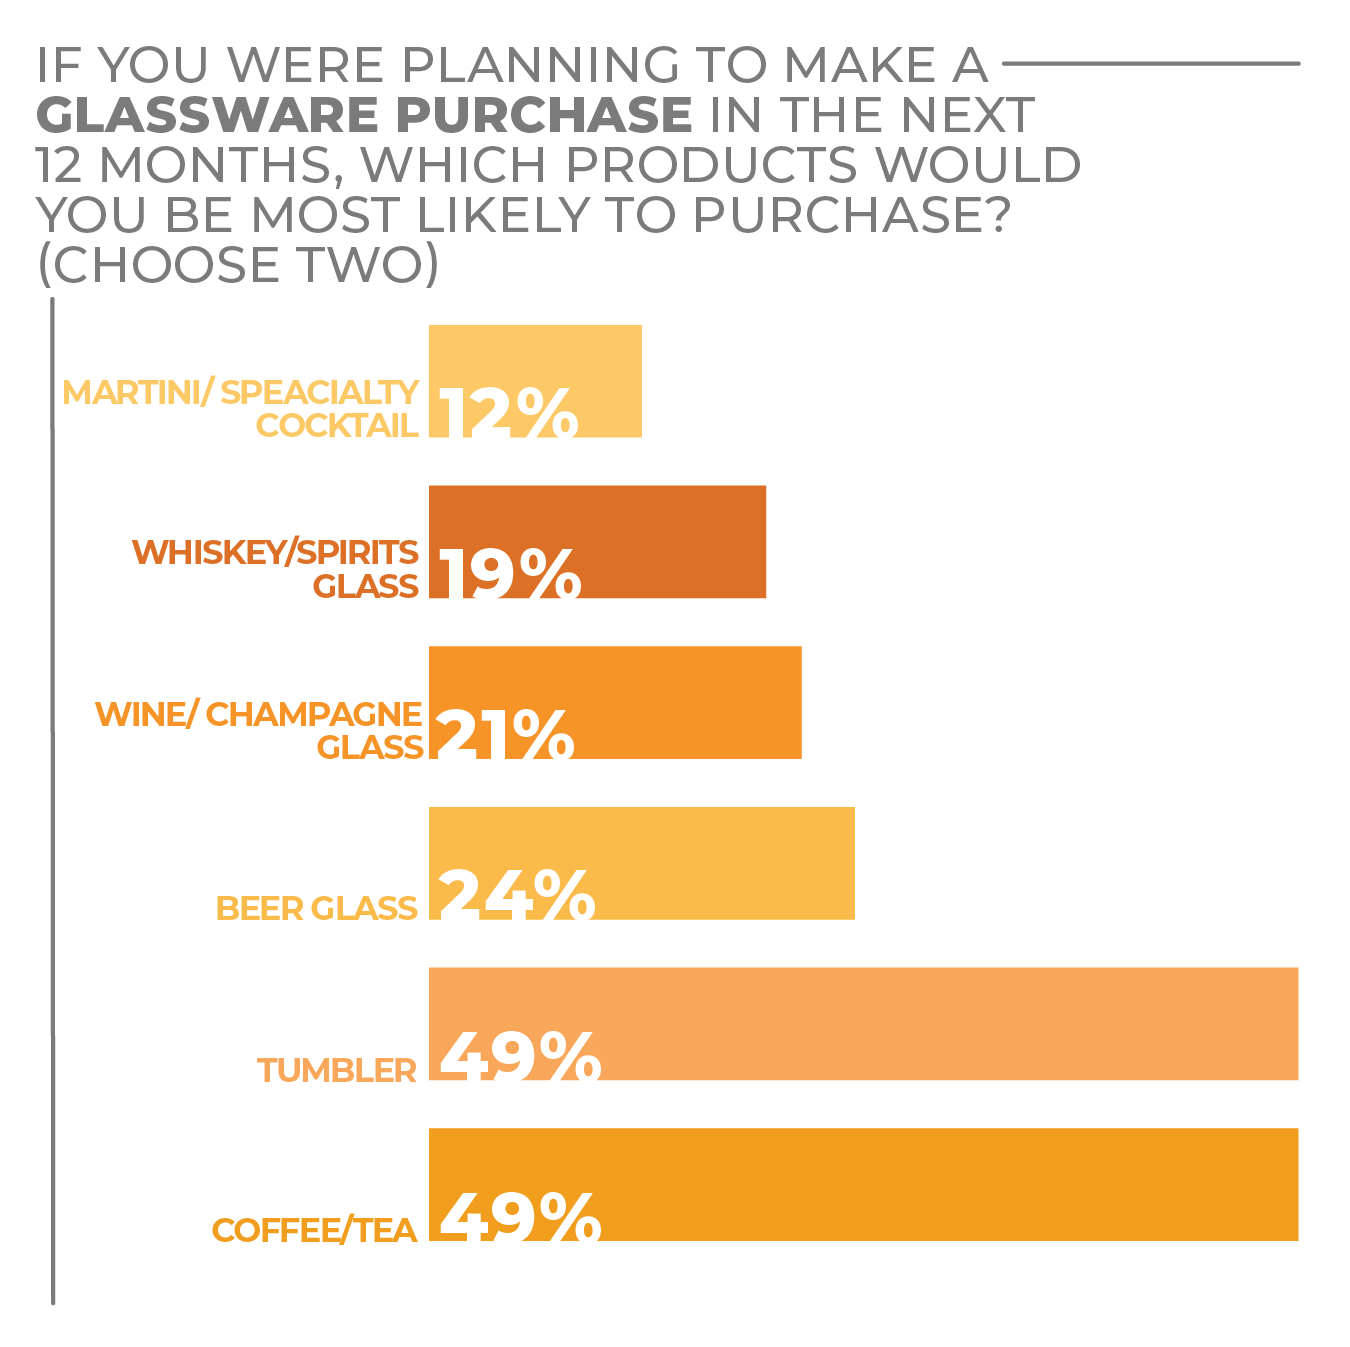
In the HomePage News 2022 Consumer Outlook Survey, 50% of respondents stated they were somewhat or very likely to make a drinkware purchase in 2022, which includes glassware.
Of course glassware spans further than just cocktail, wine and beer glasses, but also includes coffee/tea cups and tumblers. So much so that the coffee/tea cups and tumbler sub-categories each earned nearly 50% of respondents votes for the type of glassware they planned to purchase in the coming months.
However, the most activity when it comes to new ideas and designs falls among the wine and spirits glasses, as the industry embraces the popularity of bartending at home.
Vendors the past few years have been focused on drink-specific glassware, such as those for wine varietals, beers and spirits. The market is growing for such specific glassware pieces, especially among younger consumers trying to recreate their favorite beverages at home. In addition, the industry has partnered with mixologists, sommeliers, authors and chefs to help bring the professional glassware experience to consumers.
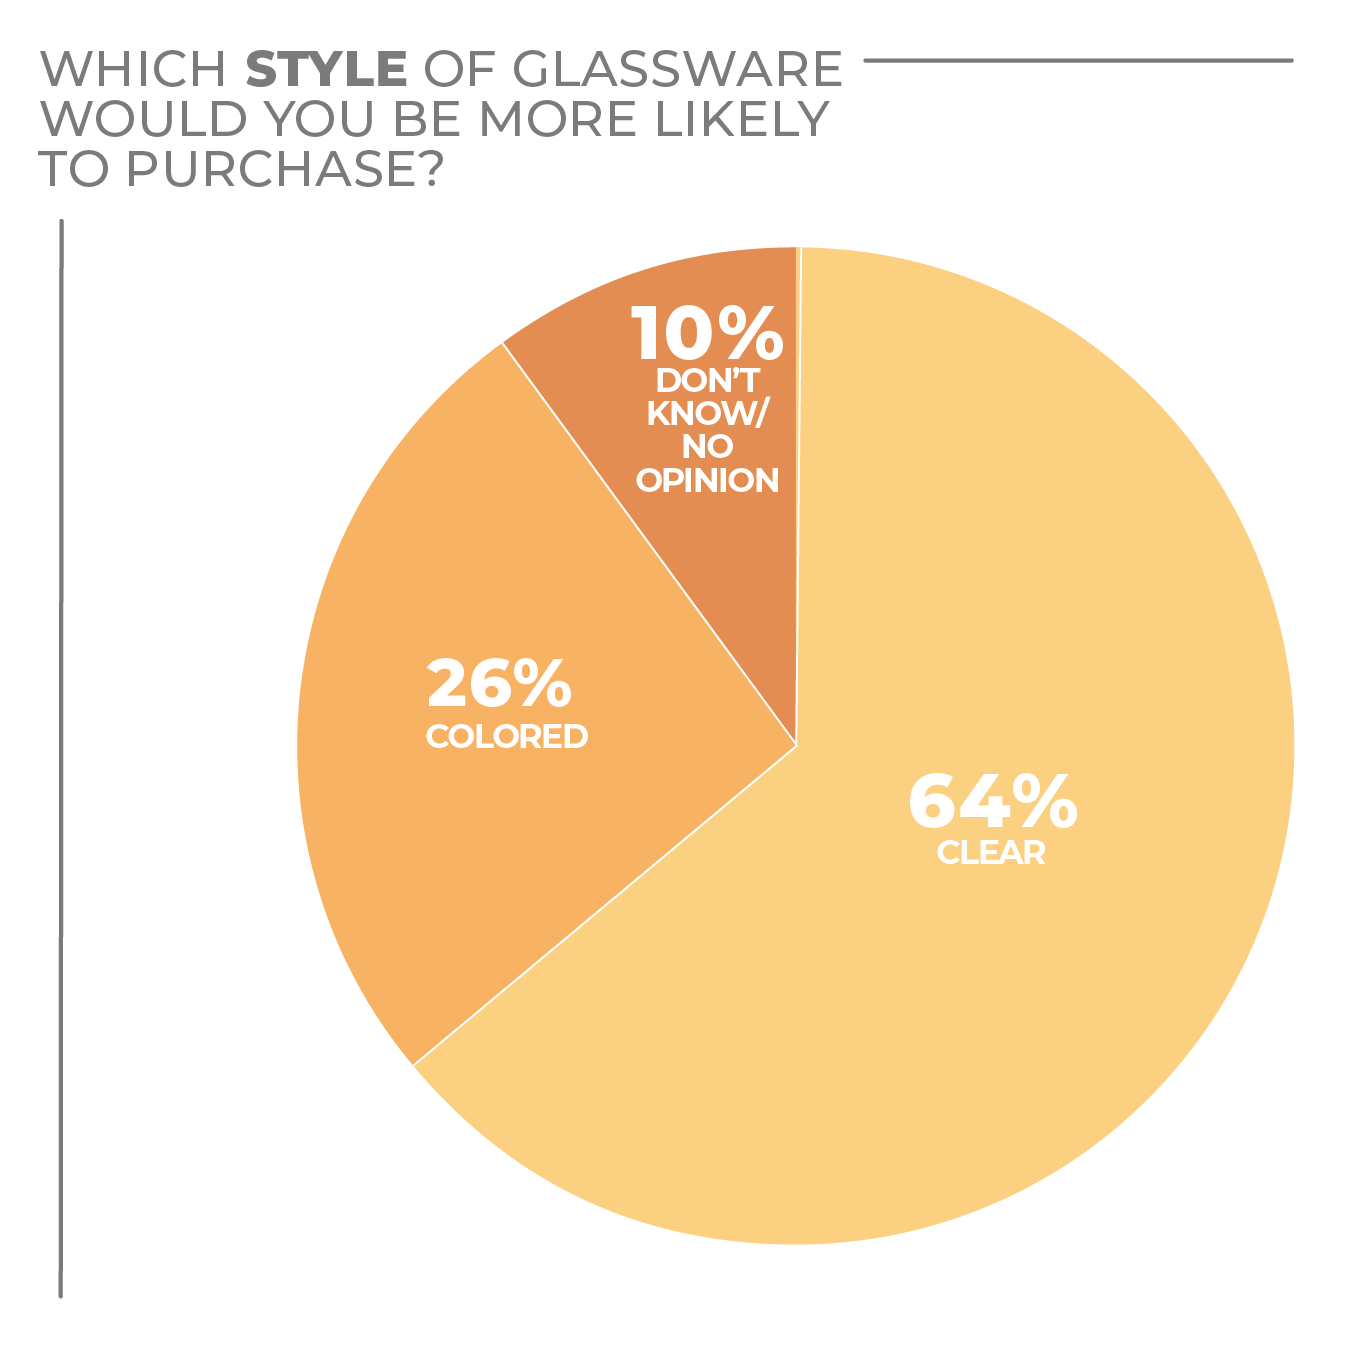
While drink-specific glassware continues its healthy growth for manufacturers, colored glassware has become a focus as well. Jewel-toned and smokey-colored glassware are making their way into collections, especially for pieces launching in the fall. Colored glassware also contributes to a personalized touch preferred by younger consumers and can be used as a decorative piece on a shelf or mantel.
While colored glass has been trending with consumers, the versatility of clear glassware has not lost its luster among consumers: 64% of survey respondents selected clear as their preference, and 26% selected colored glassware.
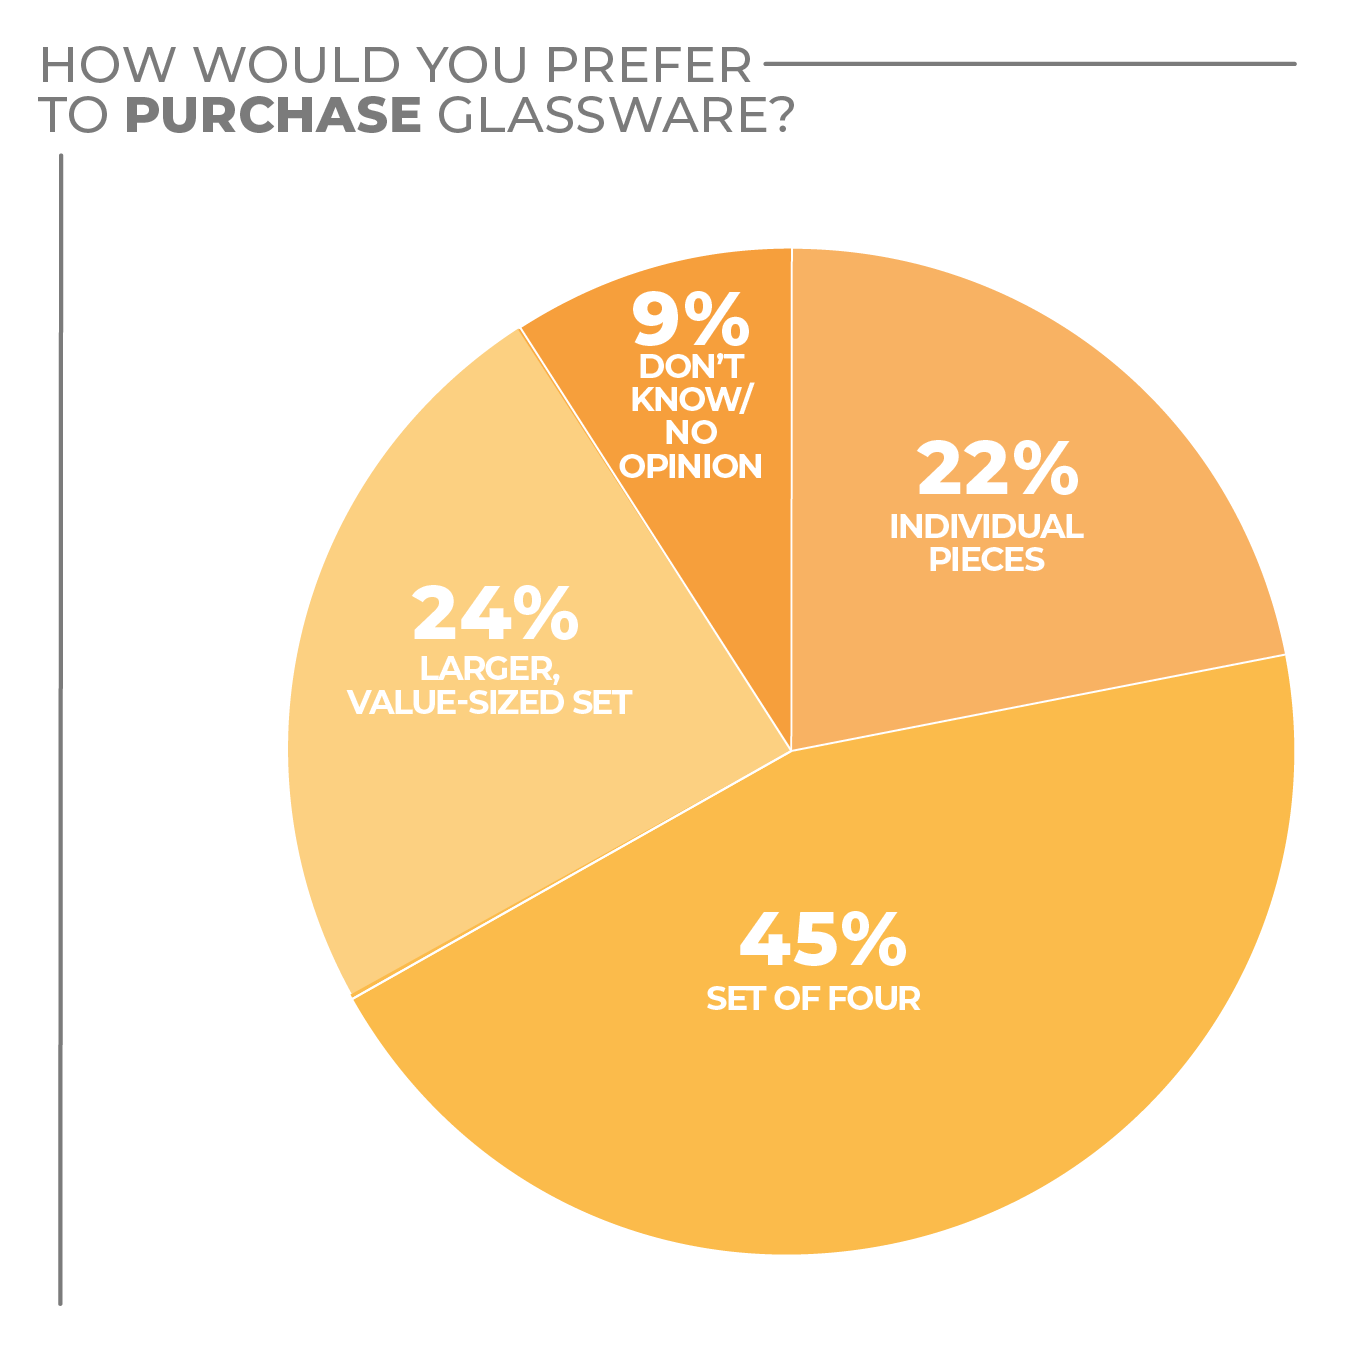
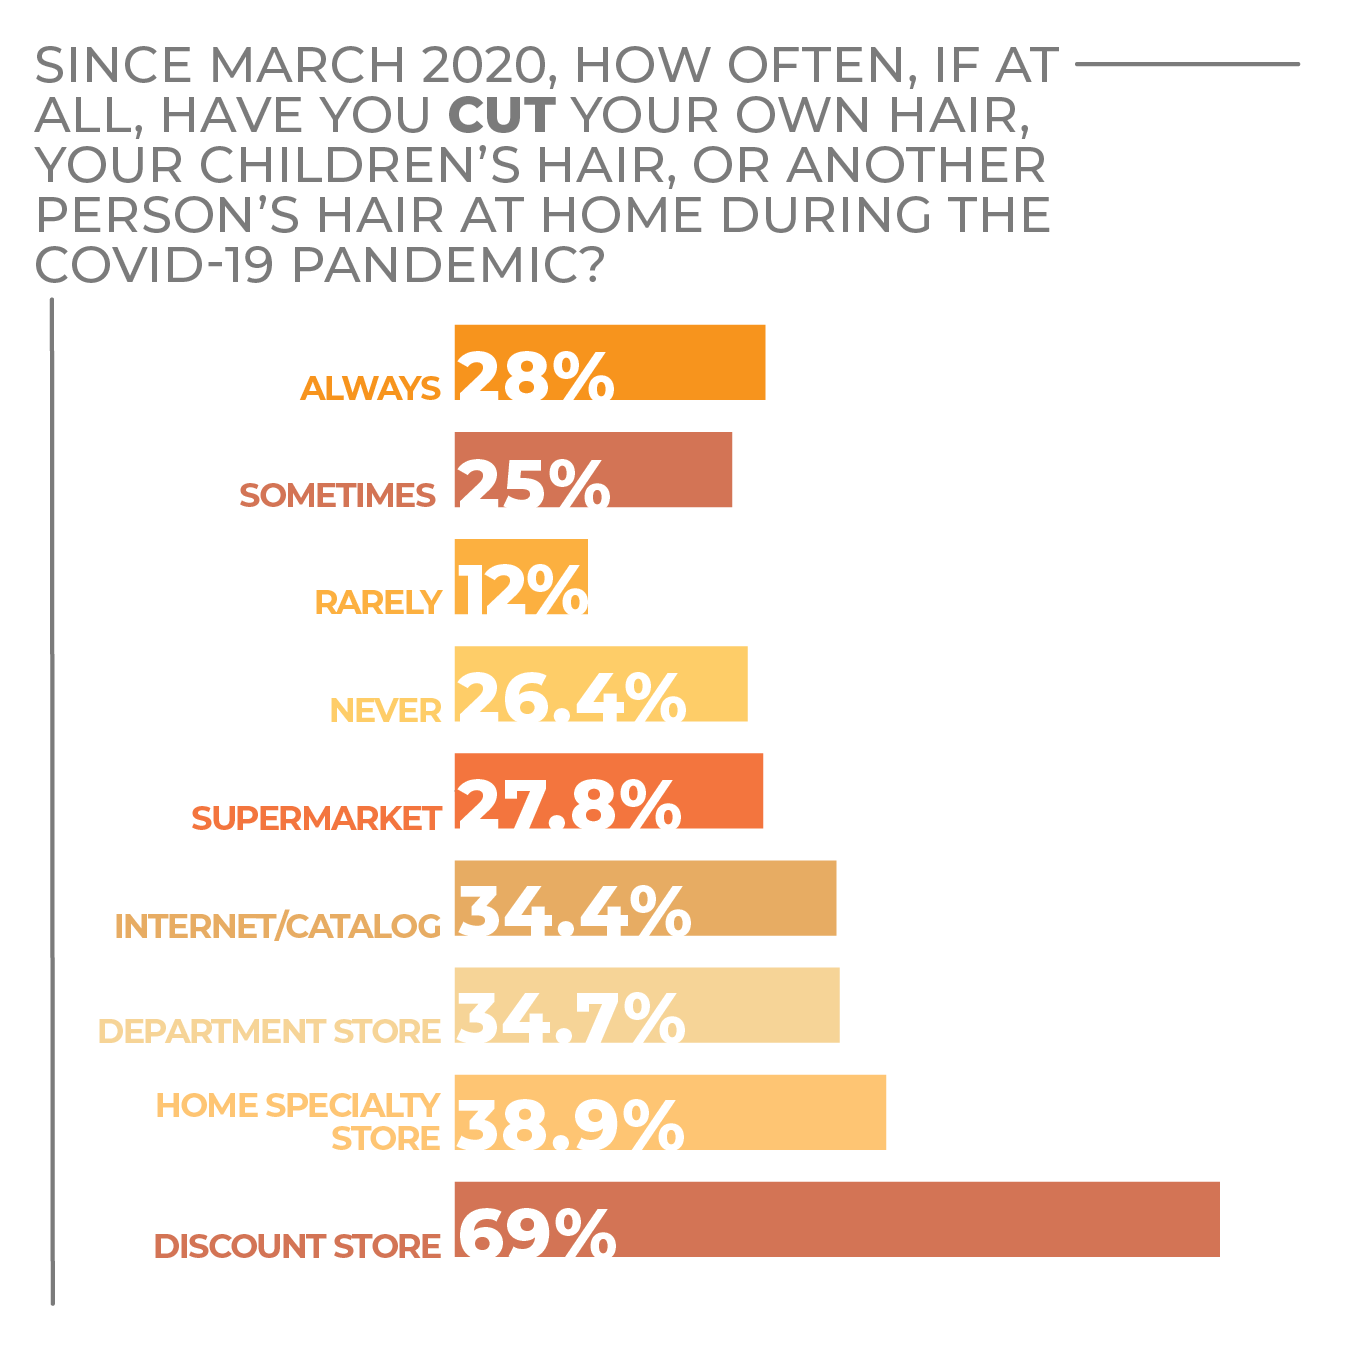
As for where consumers are shopping for their glassware, the discount stores (69%); home specialty stores (38.9%); department (34.7%) and internet/catalogs (34.4%) were the top selections.
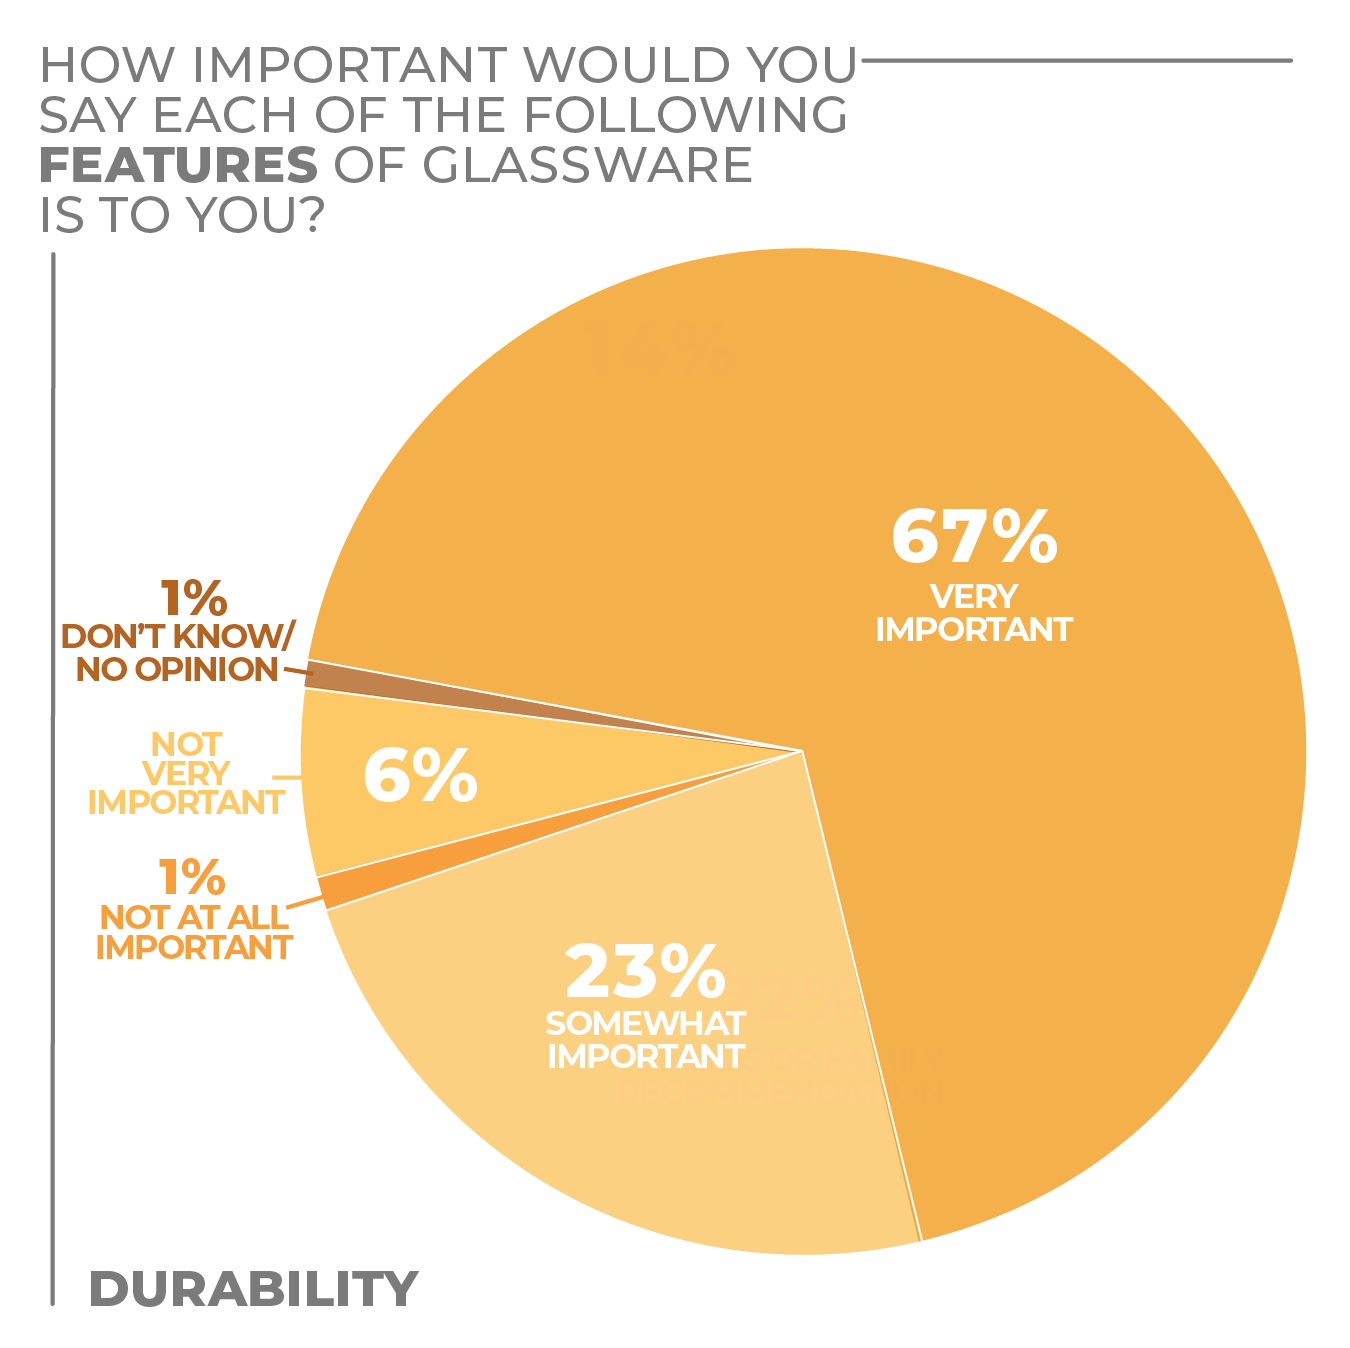
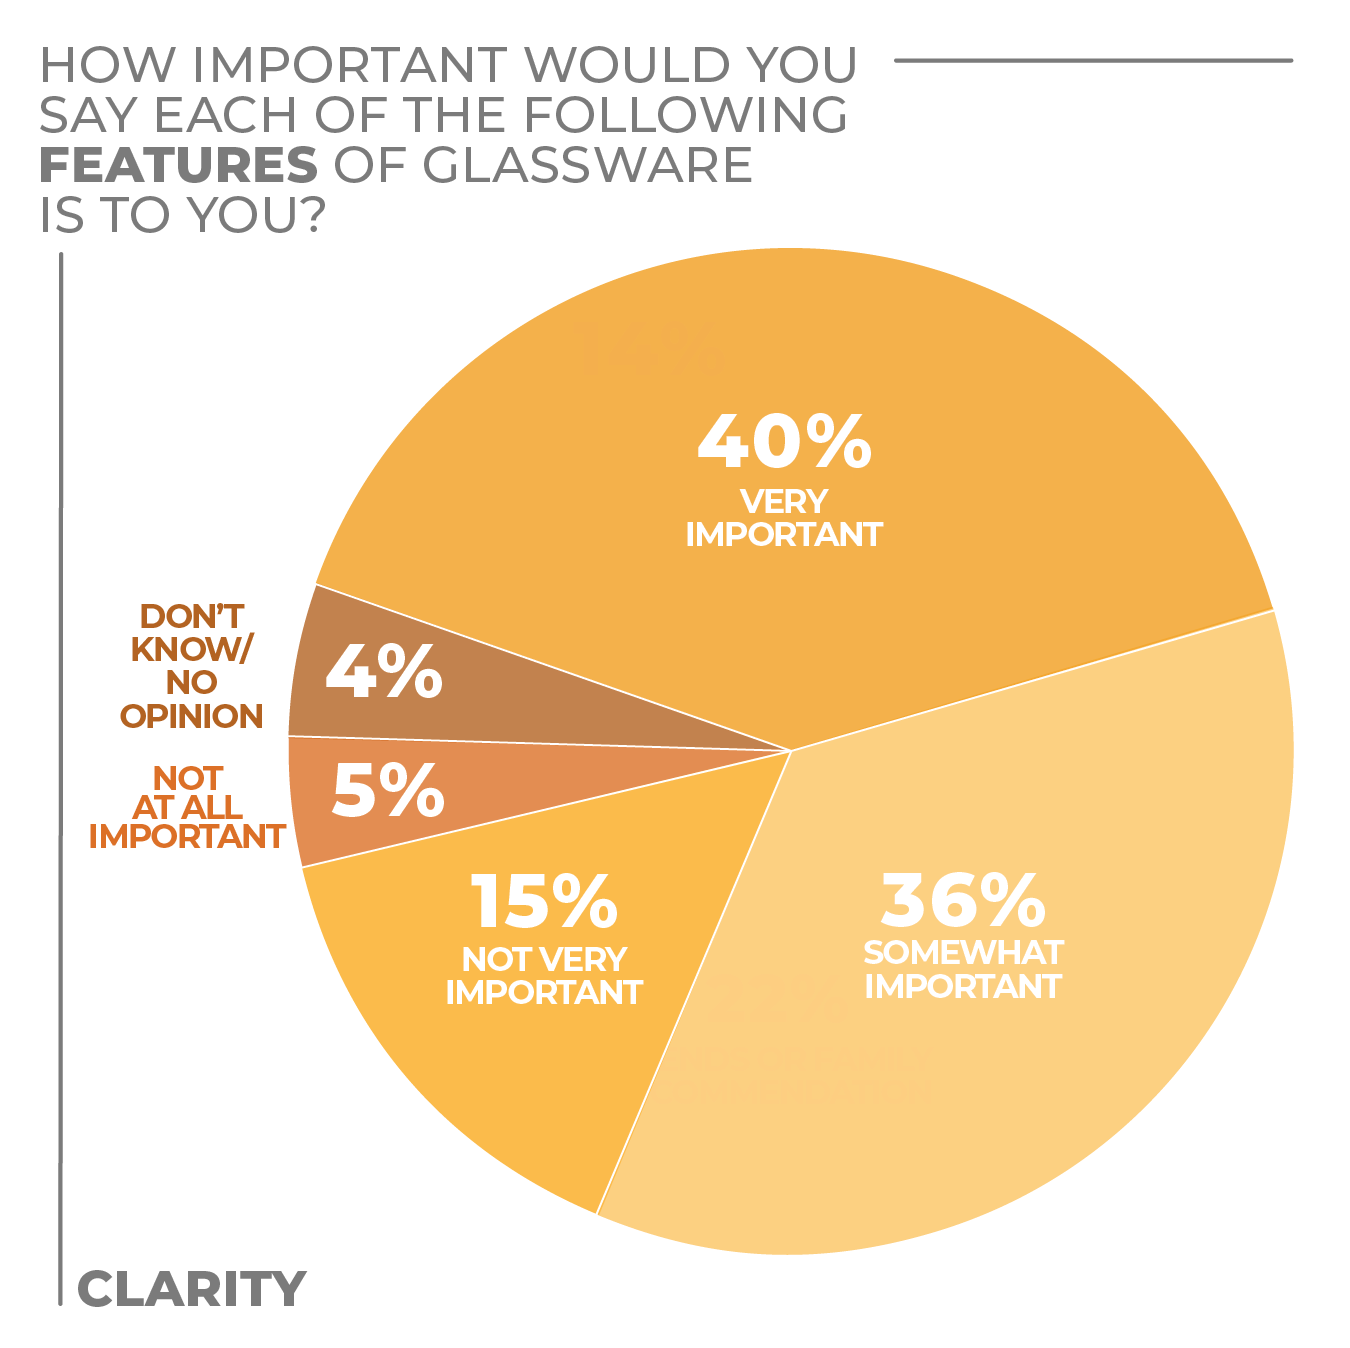
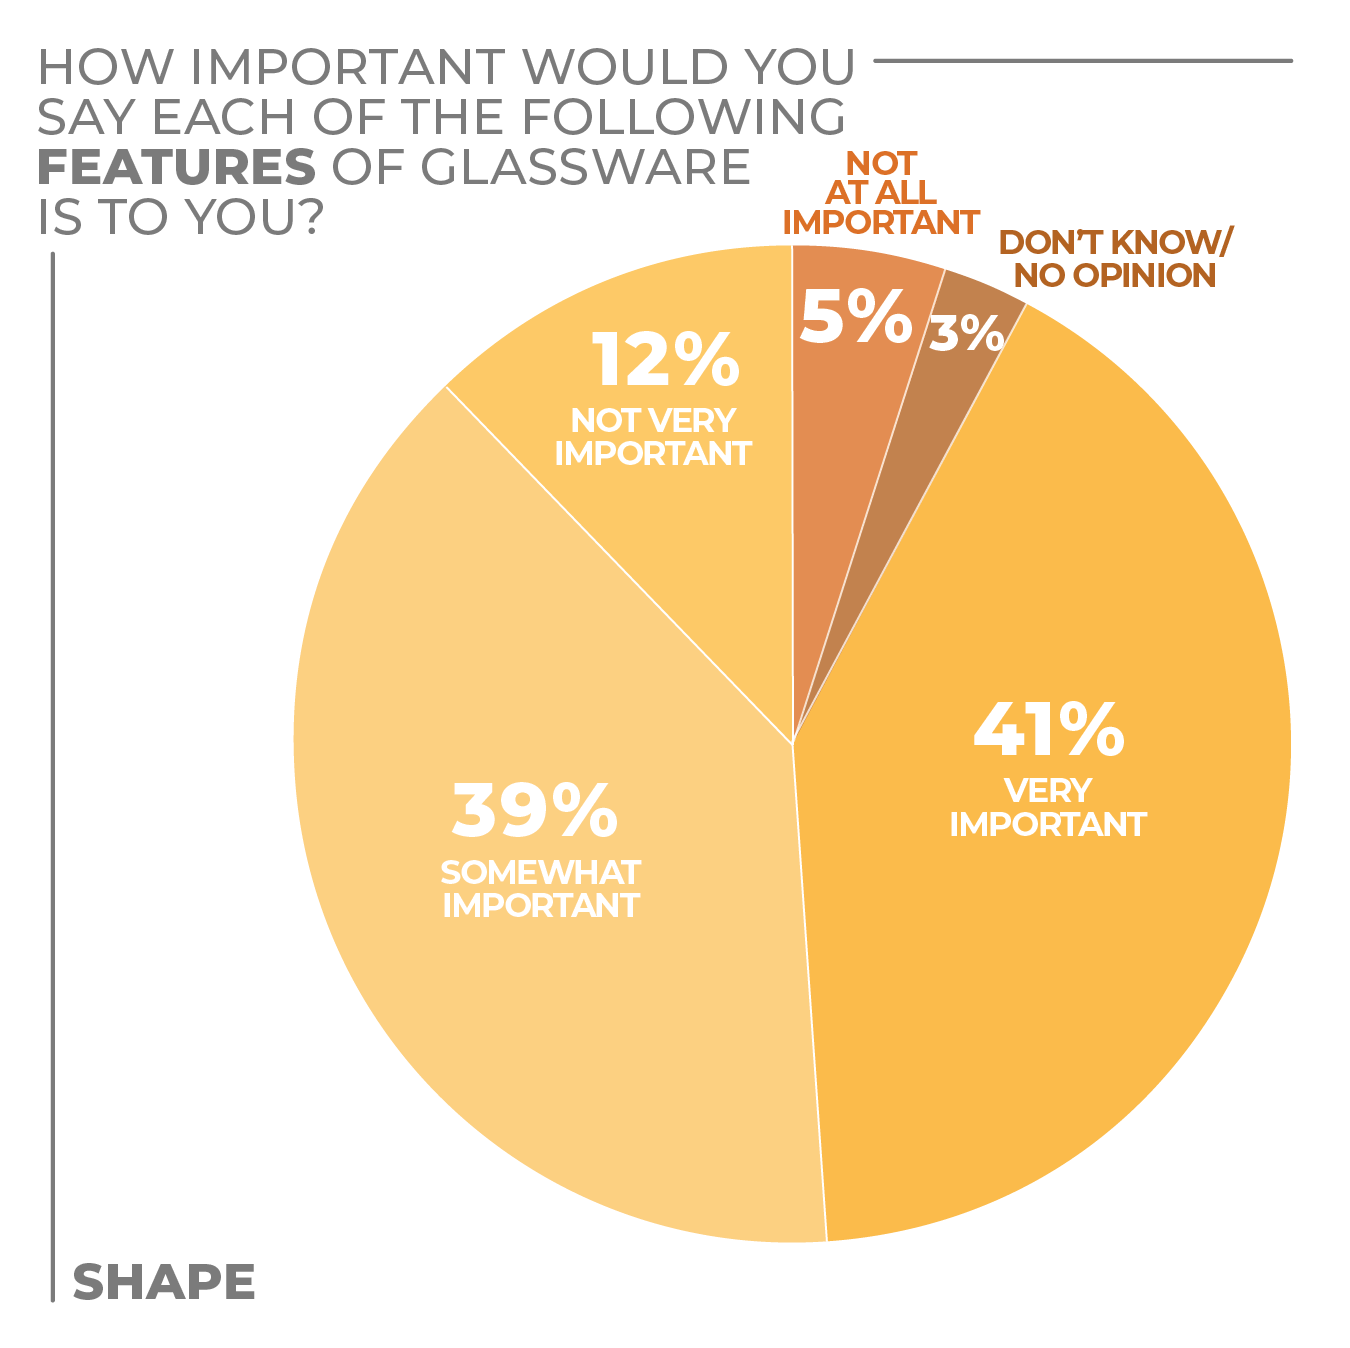
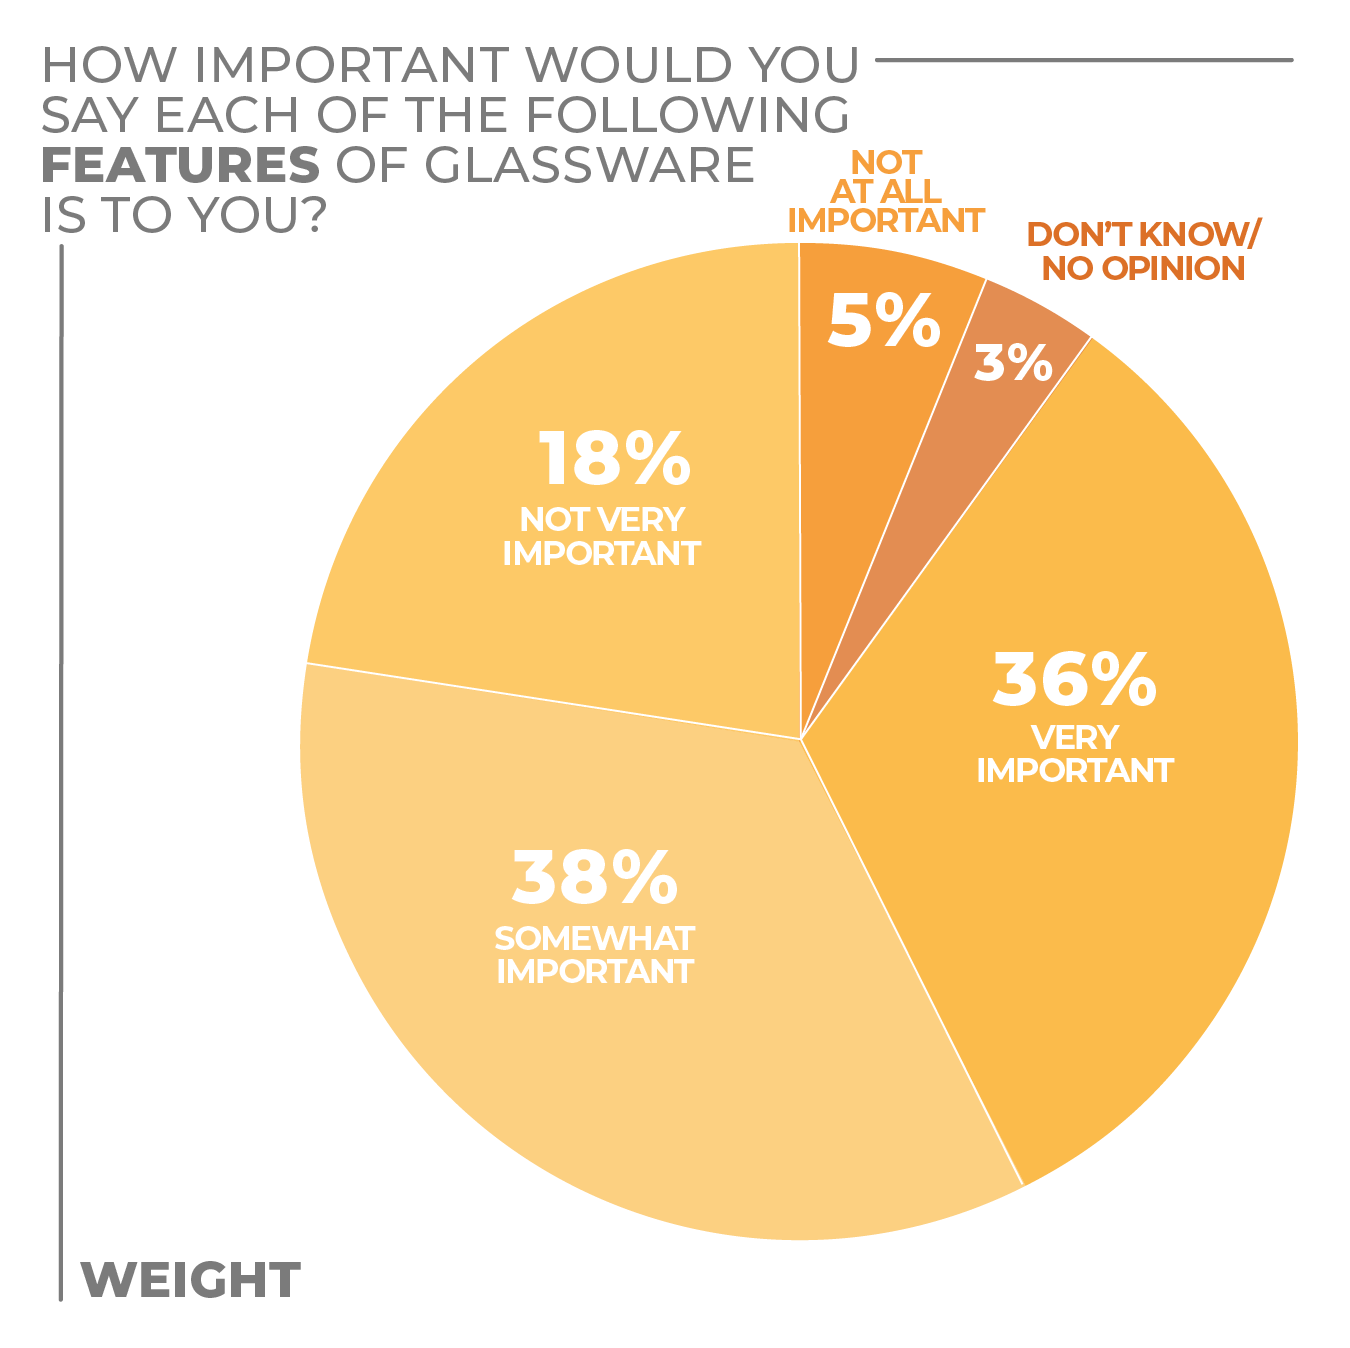
Clarity, durability and the shape of a glass were all selected as very important factors when making a glassware purchase, with weight slightly less important to consumers.
More Glassware Findings:
Click on charts to enlarge.

Home Environment
As the pandemic has made concerns about physical and mental health more acute, consumers spending more time at home have adjustments to their domestic environments to make them safer and more comforting. Expect that to continue.
In the HomePage News 2022 Consumer Outlook Survey, more than 40% of consumers are very or somewhat likely to make a home environment product purchase in the 12 months ahead.
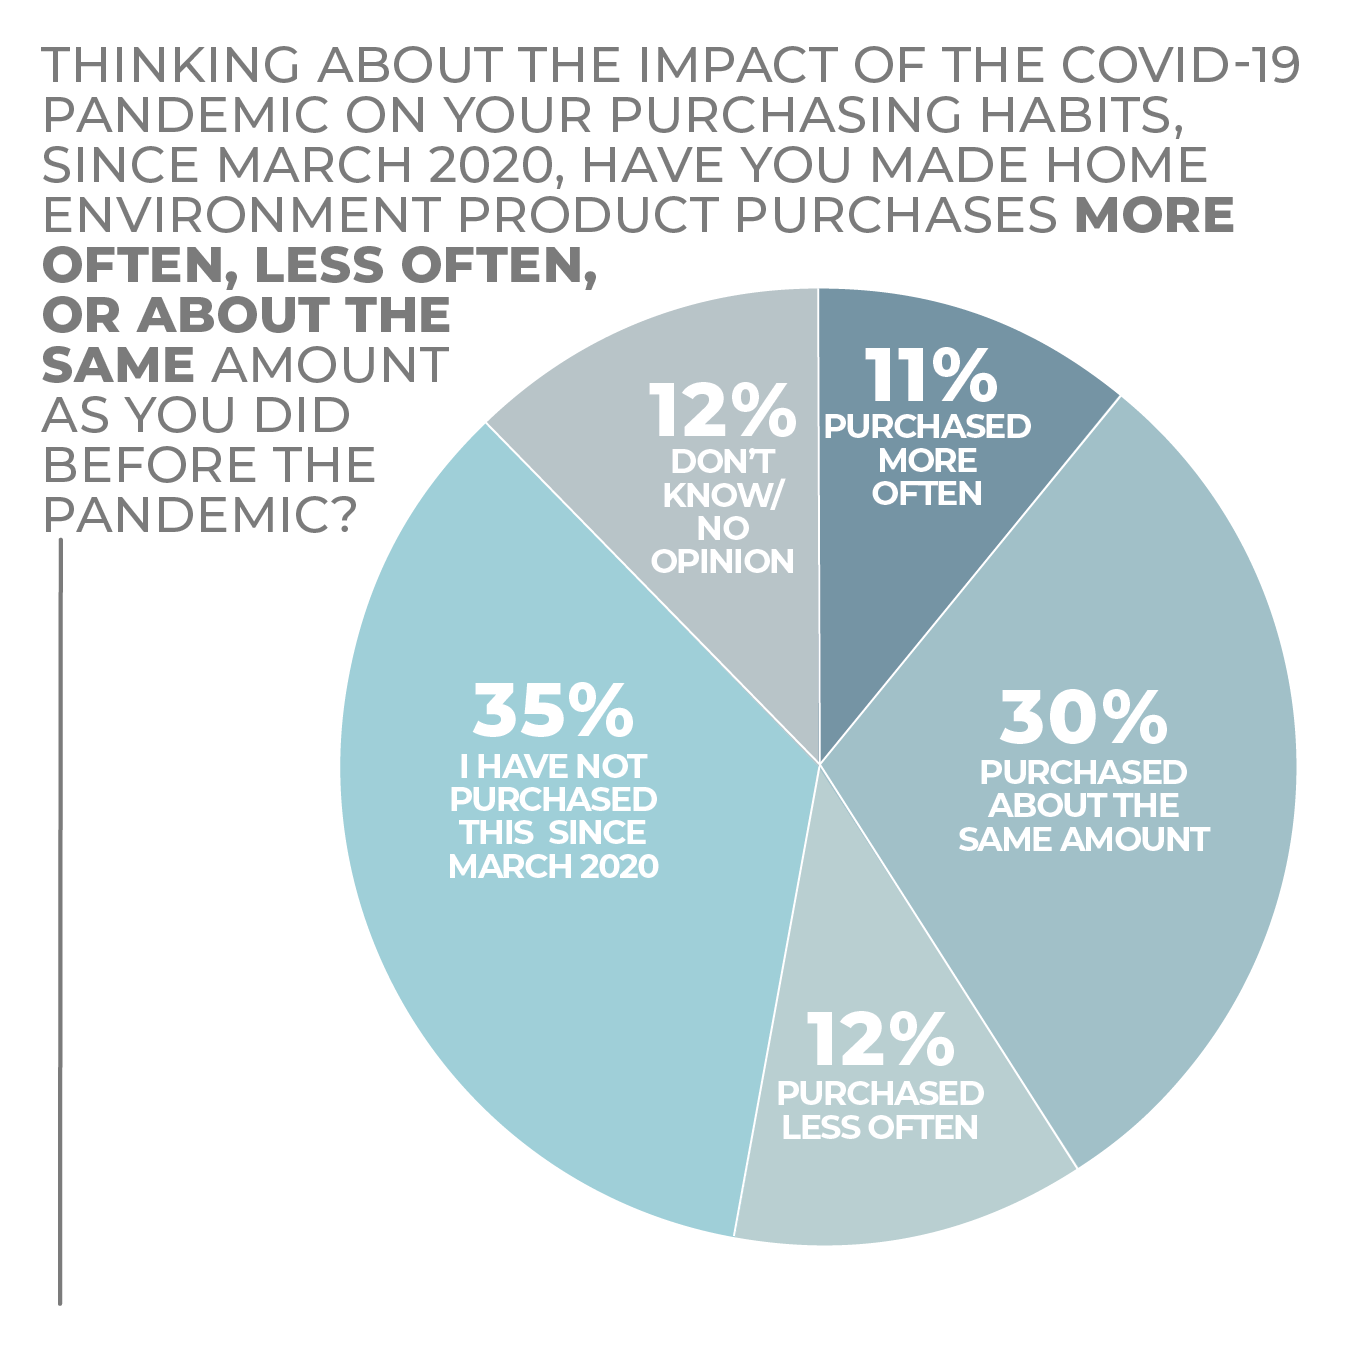
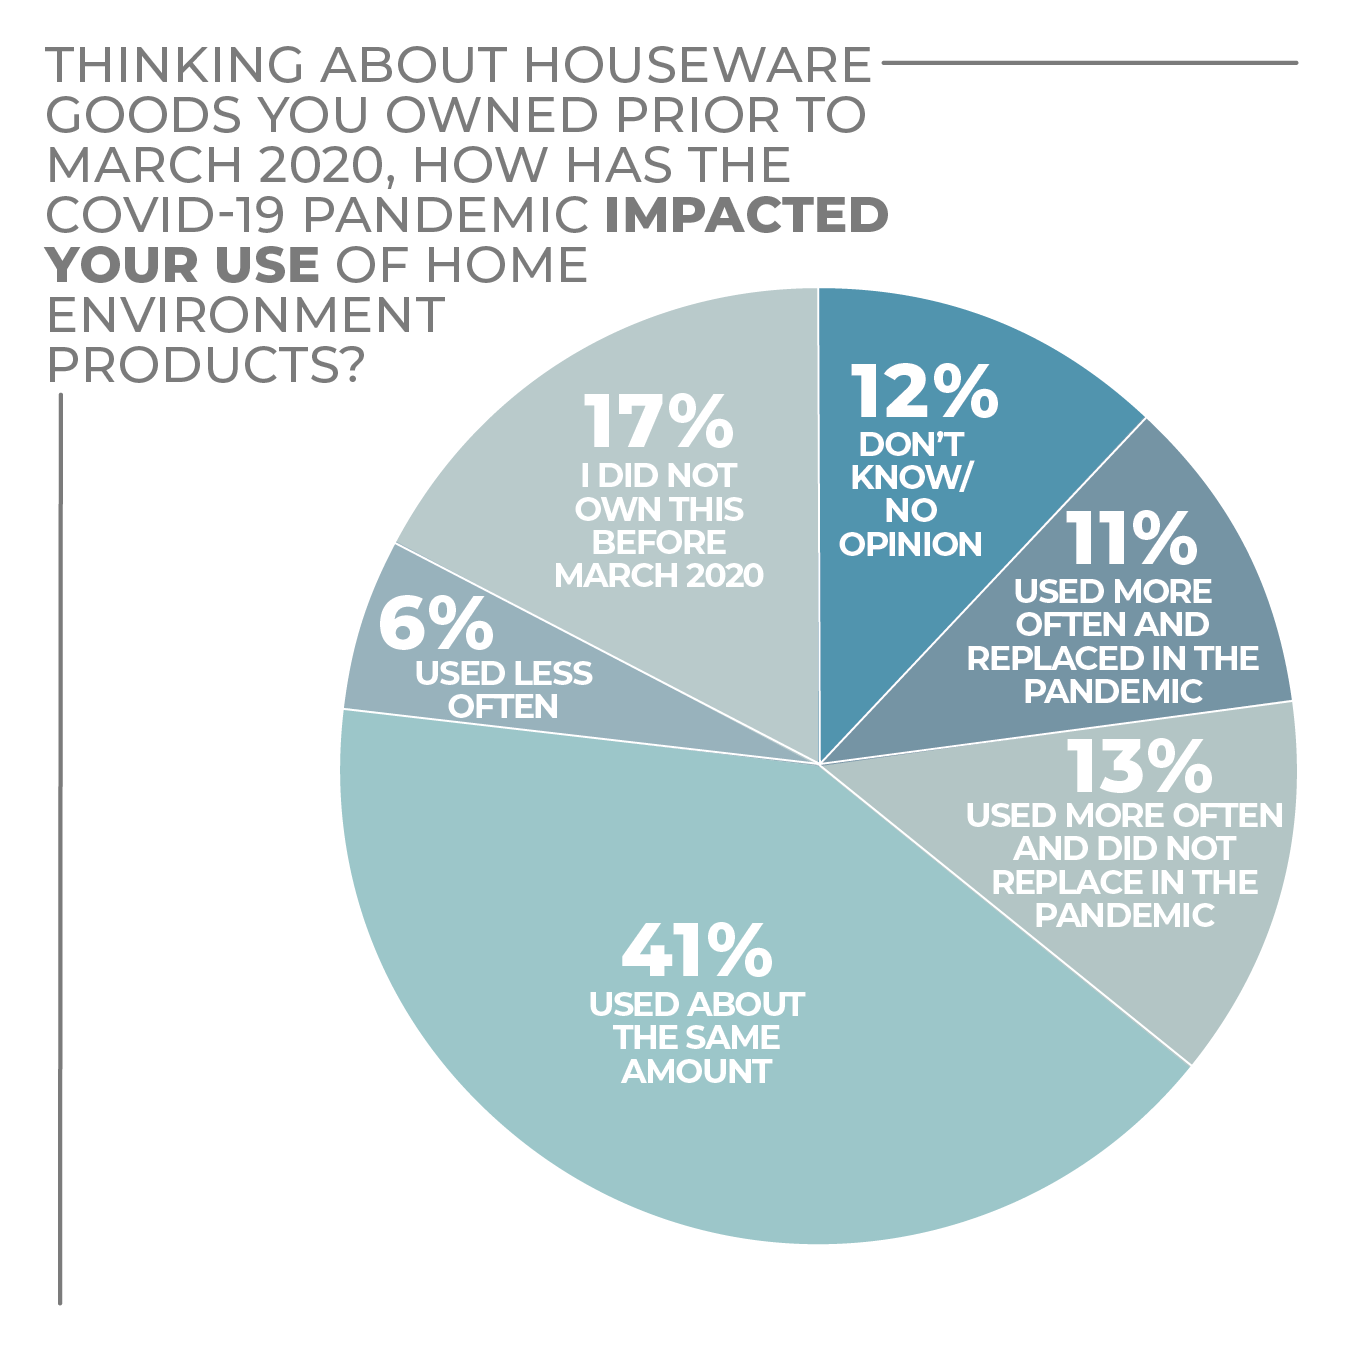
During the pandemic, 11% of survey respondents used their home environment products more often and replaced them, while 13% used them more often and did not replace them, which implies some accelerated future purchasing potential. Perhaps because so many consumers already had purchased products to address home environment issues before the pandemic, only 11% bought something in the category since the coronavirus crisis began.
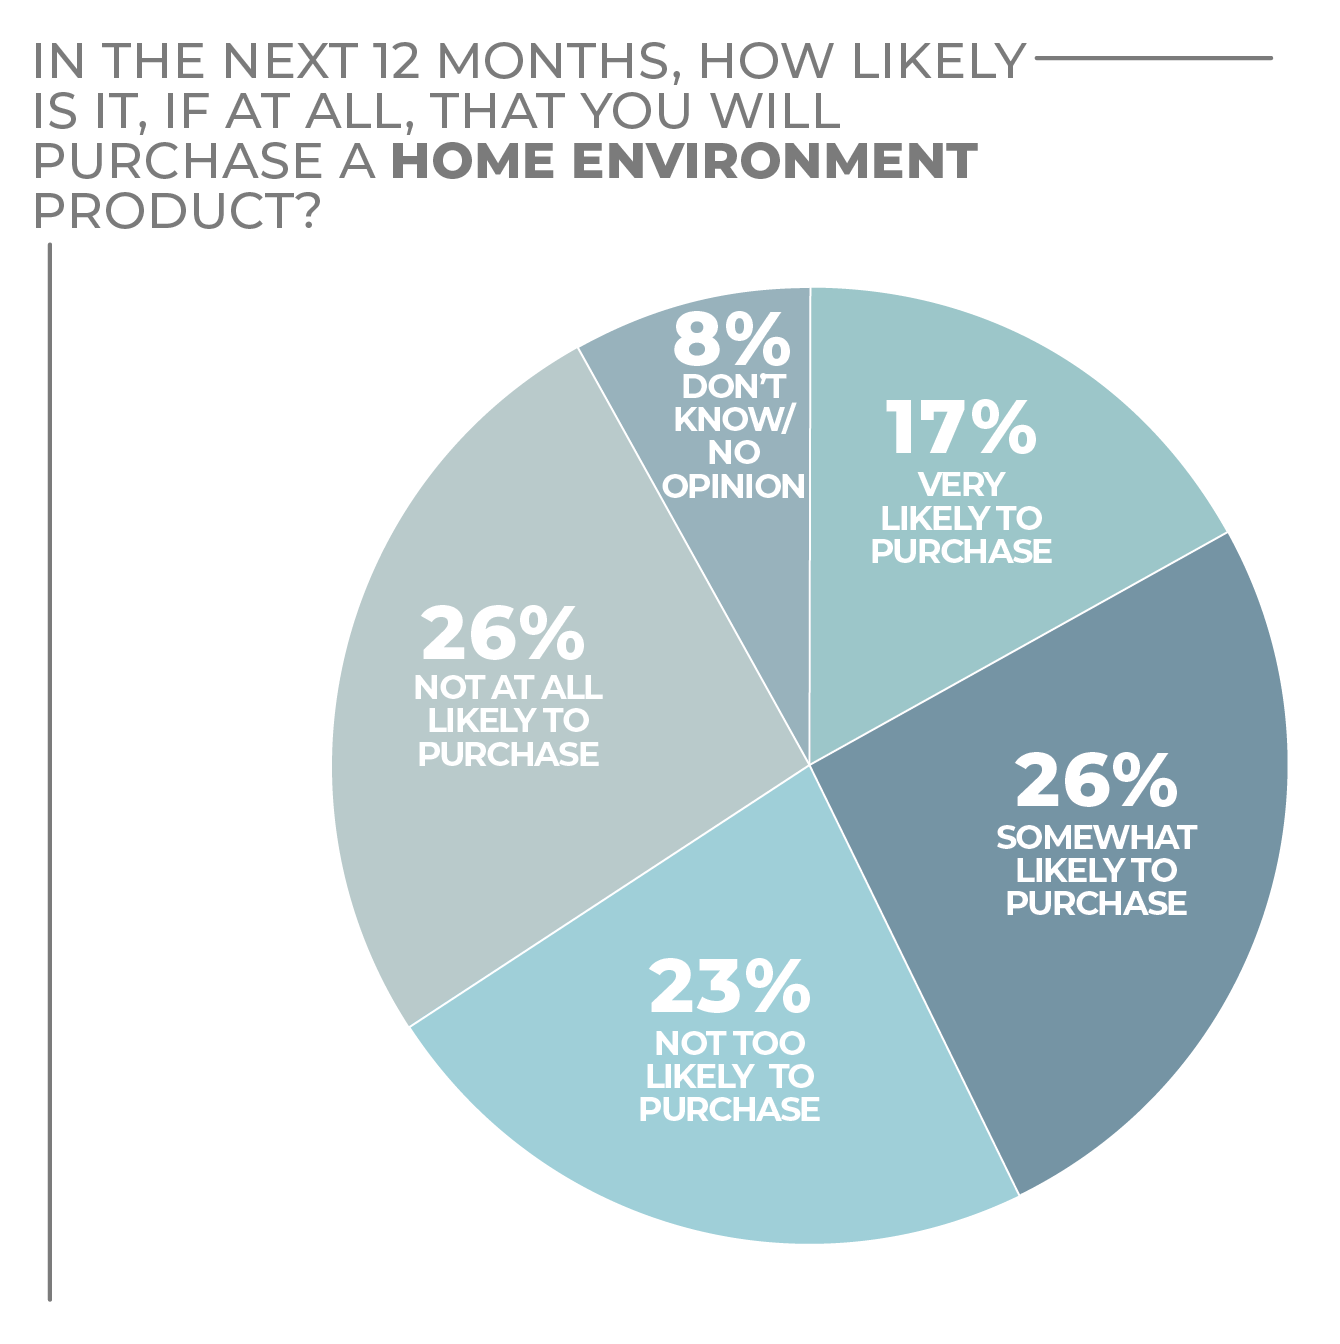
Still, 12% of respondents said they purchased home environment products less often since the start of the pandemic, and 35% said they hadn’t purchased in the category since March 2020. With 17% of respondents saying they would be very likely to purchase in the next 12 months and 26% saying they would be somewhat likely to purchase, it would seem that sales activity in the home environment category should be relatively solid and steady over the year ahead.
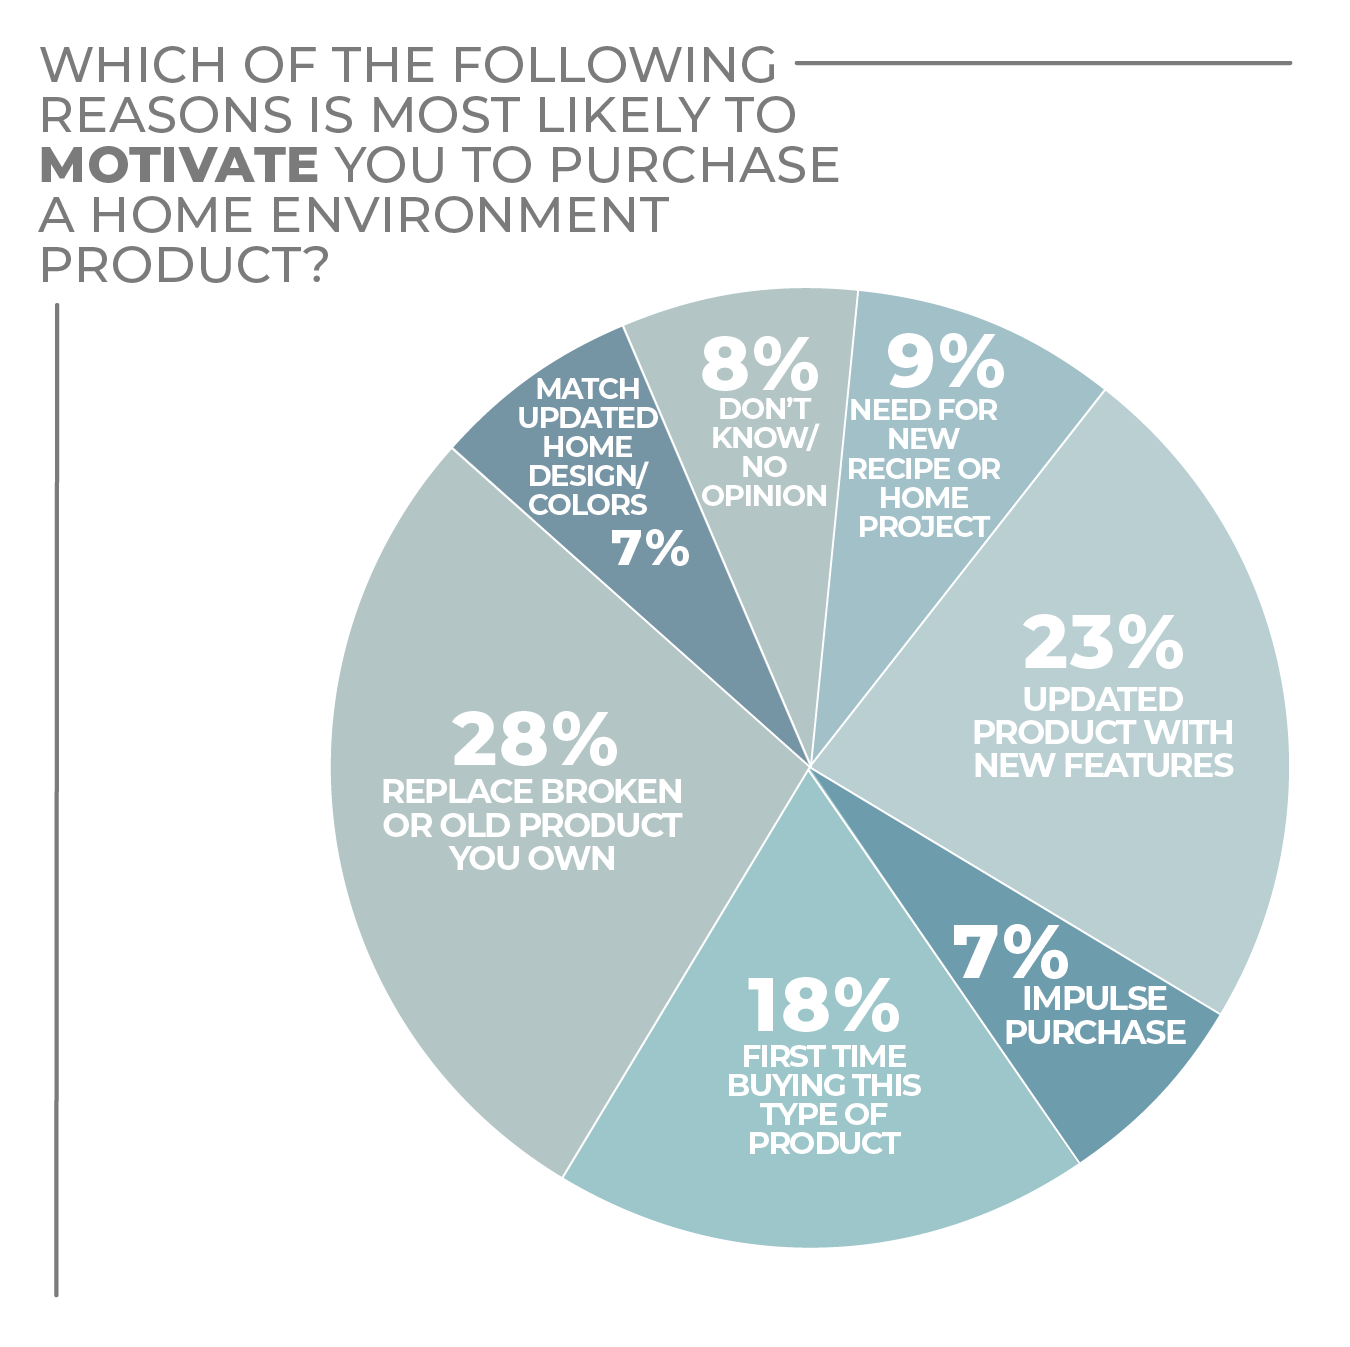
When asked about buying motivations, replacing a broken or old product was at the top at 28%, and the attraction of new features was a strong second at 23%, suggesting near-future purchasing could focus on innovative products.
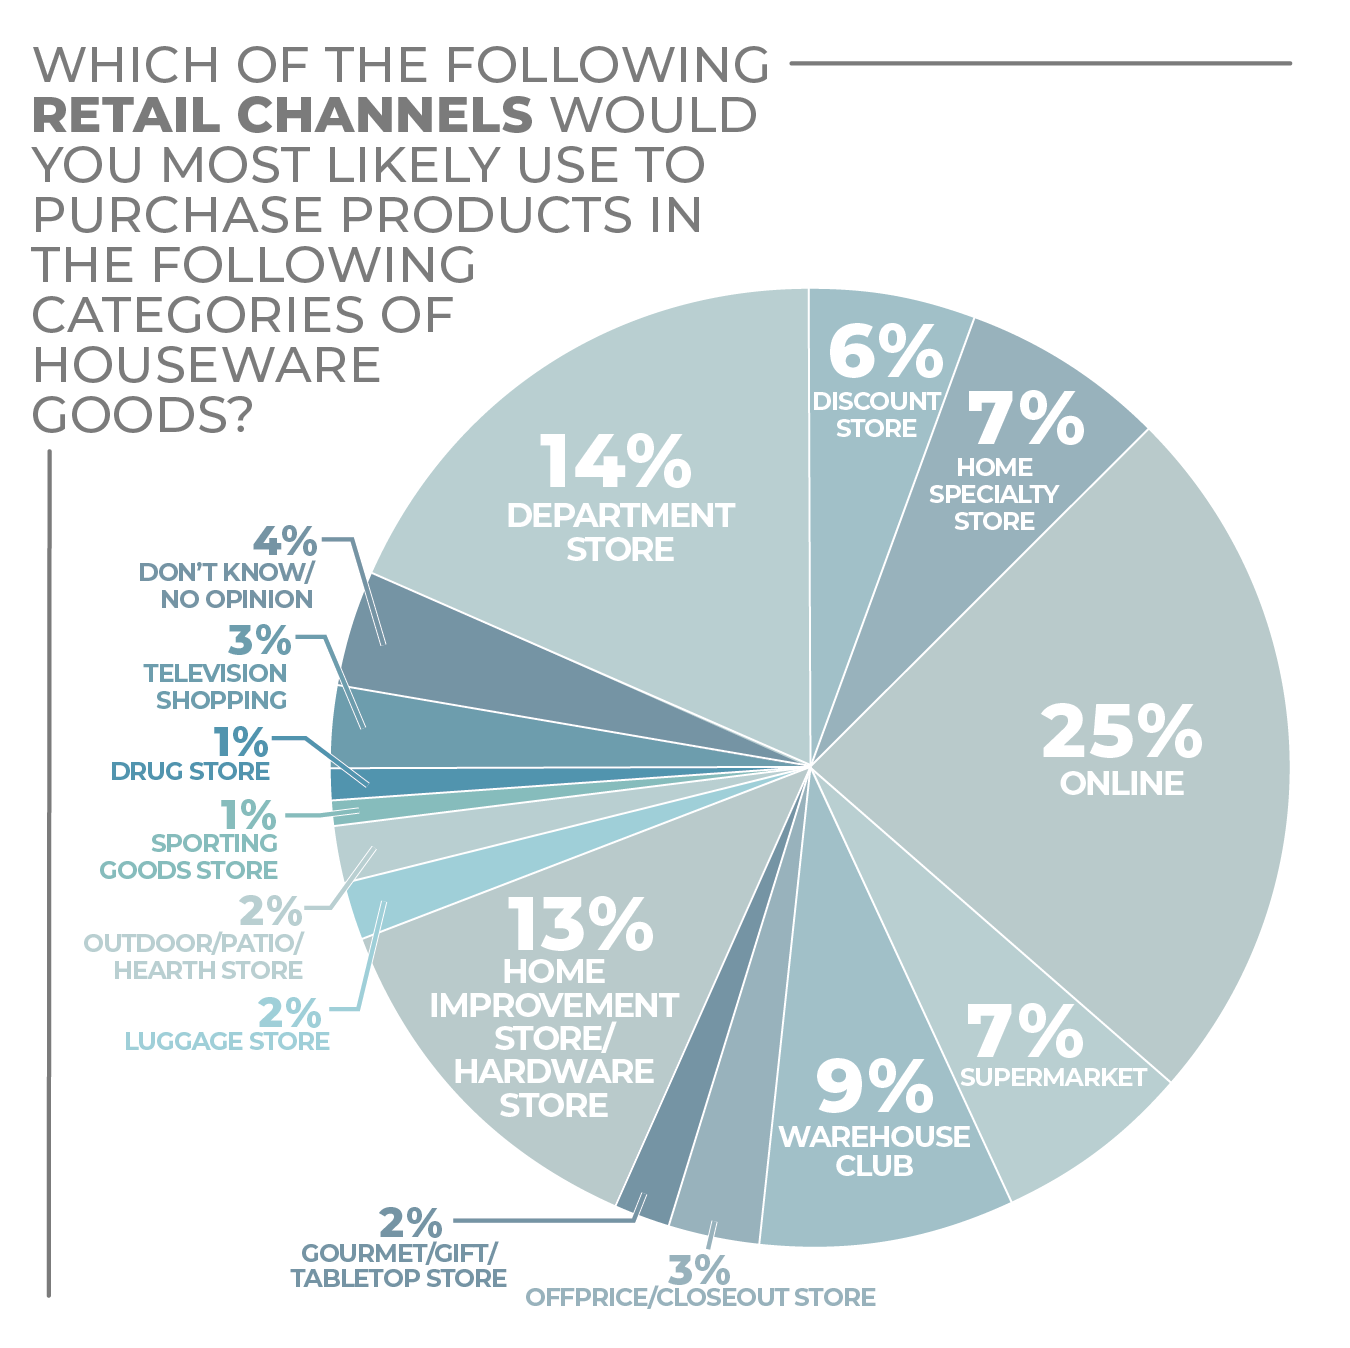
Although digital shopping was not always the first choice of respondents in the survey, 25% of consumers polled were most likely to purchase home environment items online. The home improvement/hardware channel also came in strong when it came to home environment product purchasing, preferred by 13% of respondents and in third place by just a point.
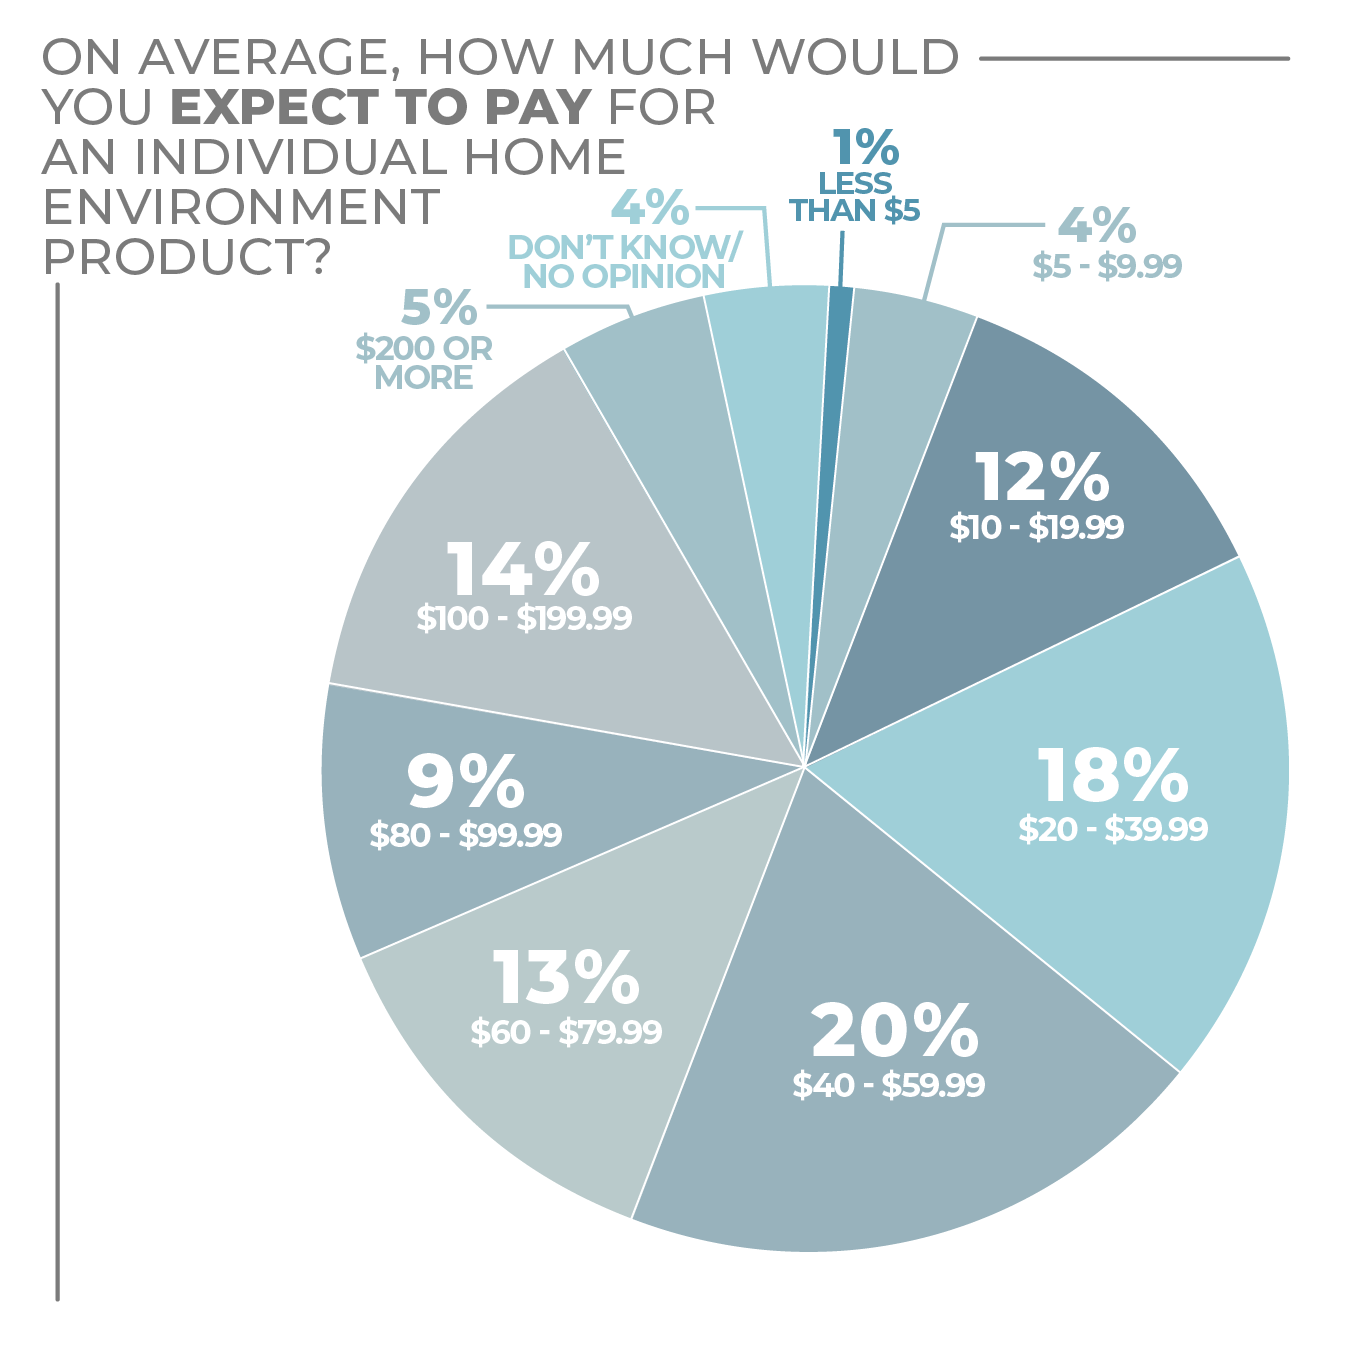
In terms of price point, the sweet spot was broad, as might be expected of products that have such a range of applied technology. Prices from $10 to $79.99 received strong consideration from consumers along with the $100-to-$199.99, trailing only the $40-to-$59.99 and $20-to-$39.99 designations in consumer preference.
In the survey, men were more interested in home environment products than women, with 19% of men very likely and 28% somewhat likely to purchase versus women at 15% and 23%, respectively.
Perhaps because they’ve recently been setting up households, Millennials lead in both the very likely (27%) and somewhat likely (33%) categories in regard to a home environment product purchase. Gen Zers and Gen Xers follow with very similar responses, but a big falloff occurs with Baby Boomers, with 9% very likely and 19% somewhat likely responses.
Urbanites are the most enthusiastic about home environment products, with 24% very likely and 28% somewhat likely to purchase. Suburbanites and rural residents trail significantly in the very likely designation and less so in the somewhat likely. Northeasterners, at 20%, are the most likely to purchase home environment products in terms of regional affinity, closely followed by Westerners at 19%, Southerners at 16% and Midwesterners at 13%. The differences are narrower with the somewhat likely response at 27% out West, 26% down South and 25% in both the Northeast and Midwest.
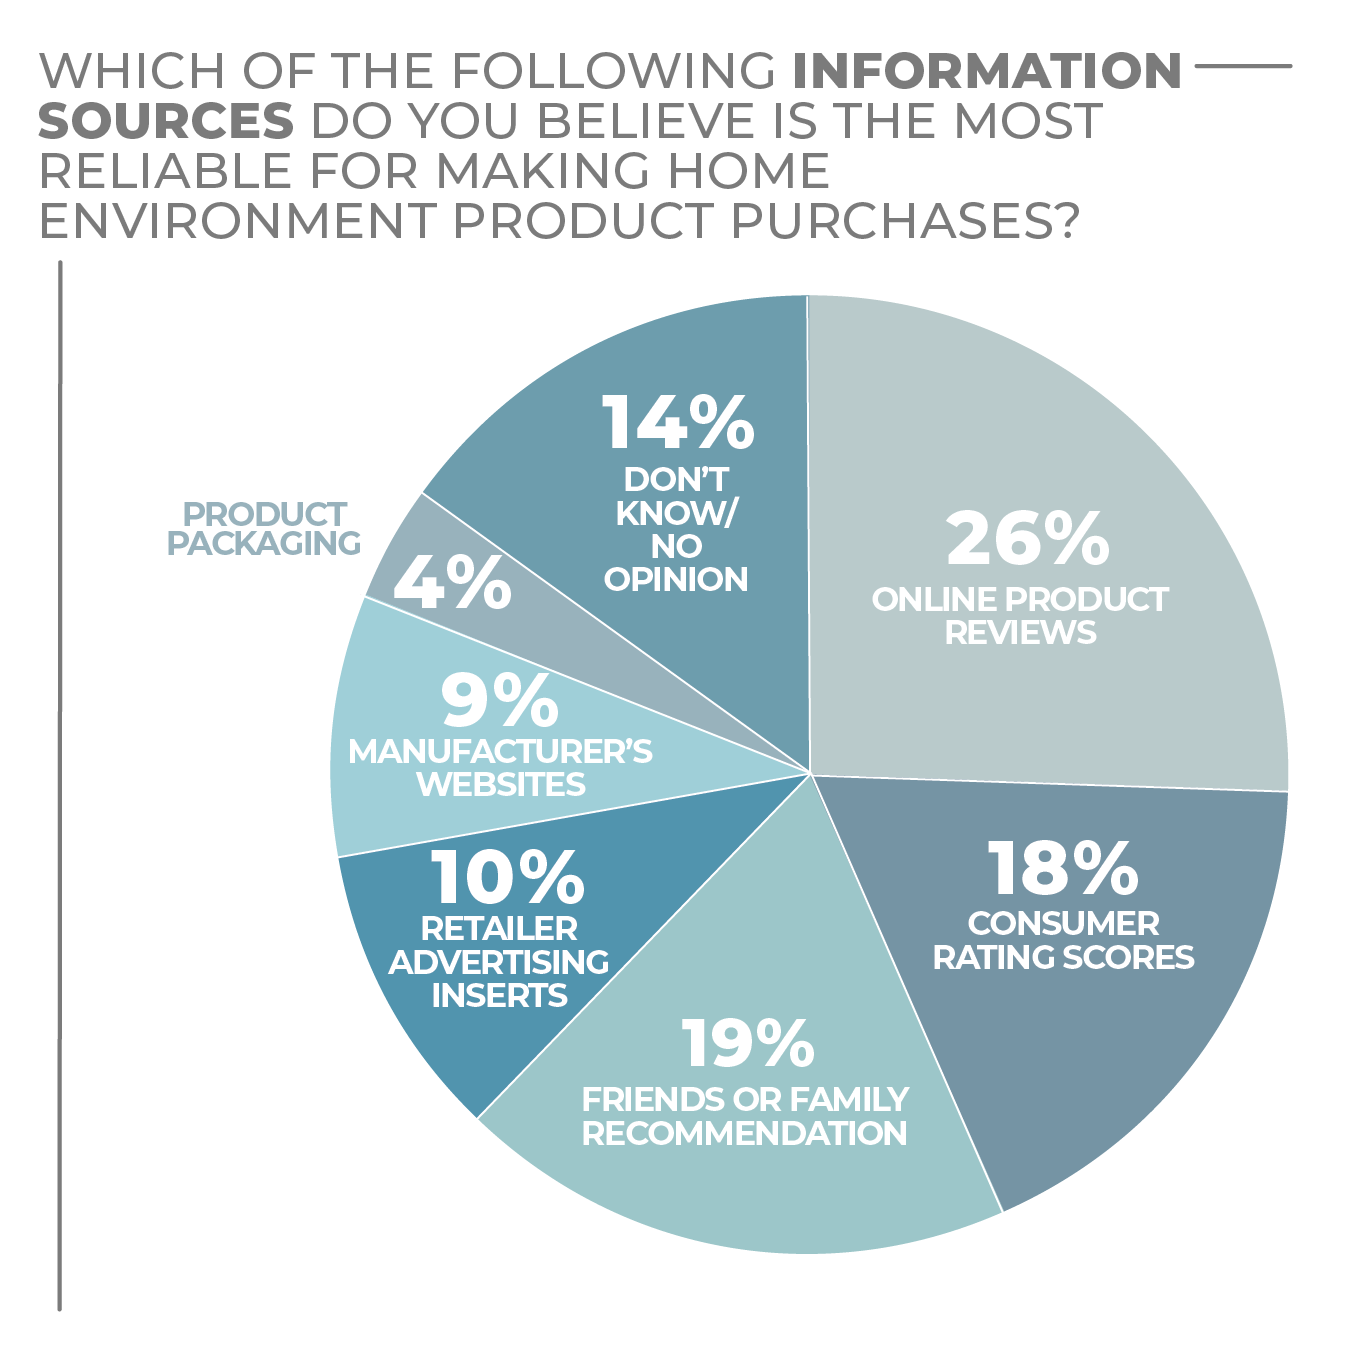
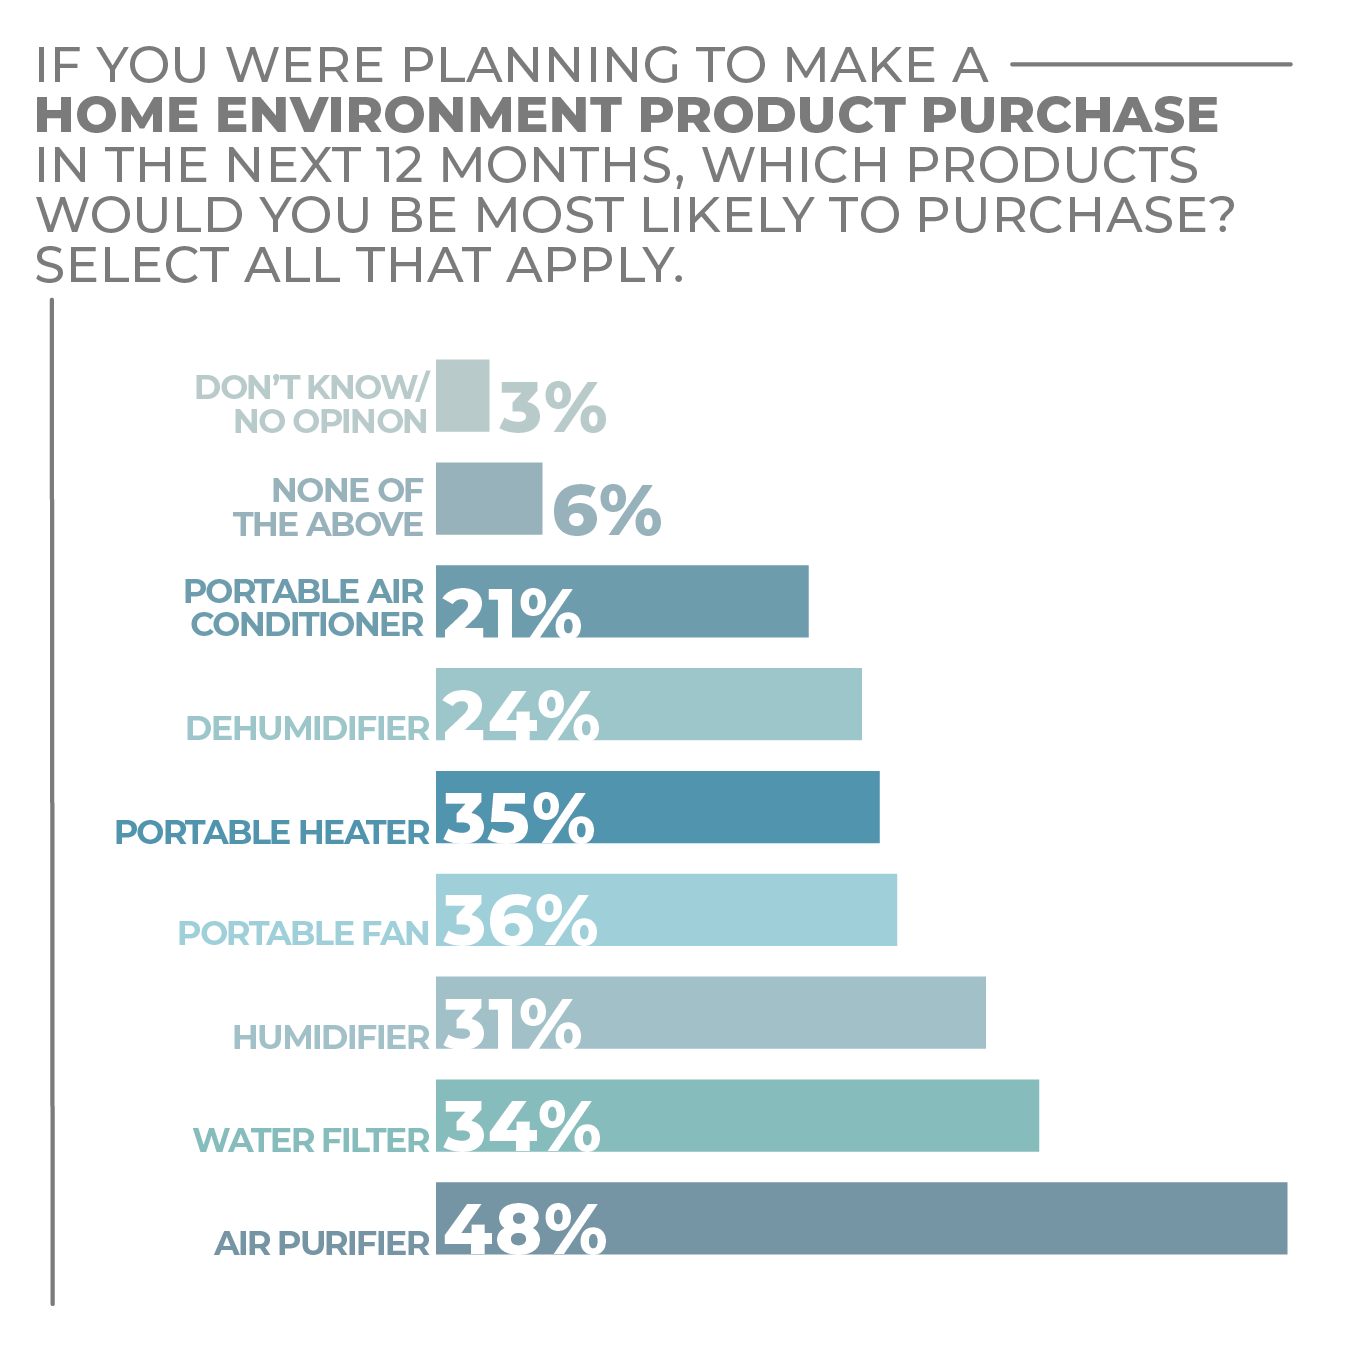
More Home Environment Findings:
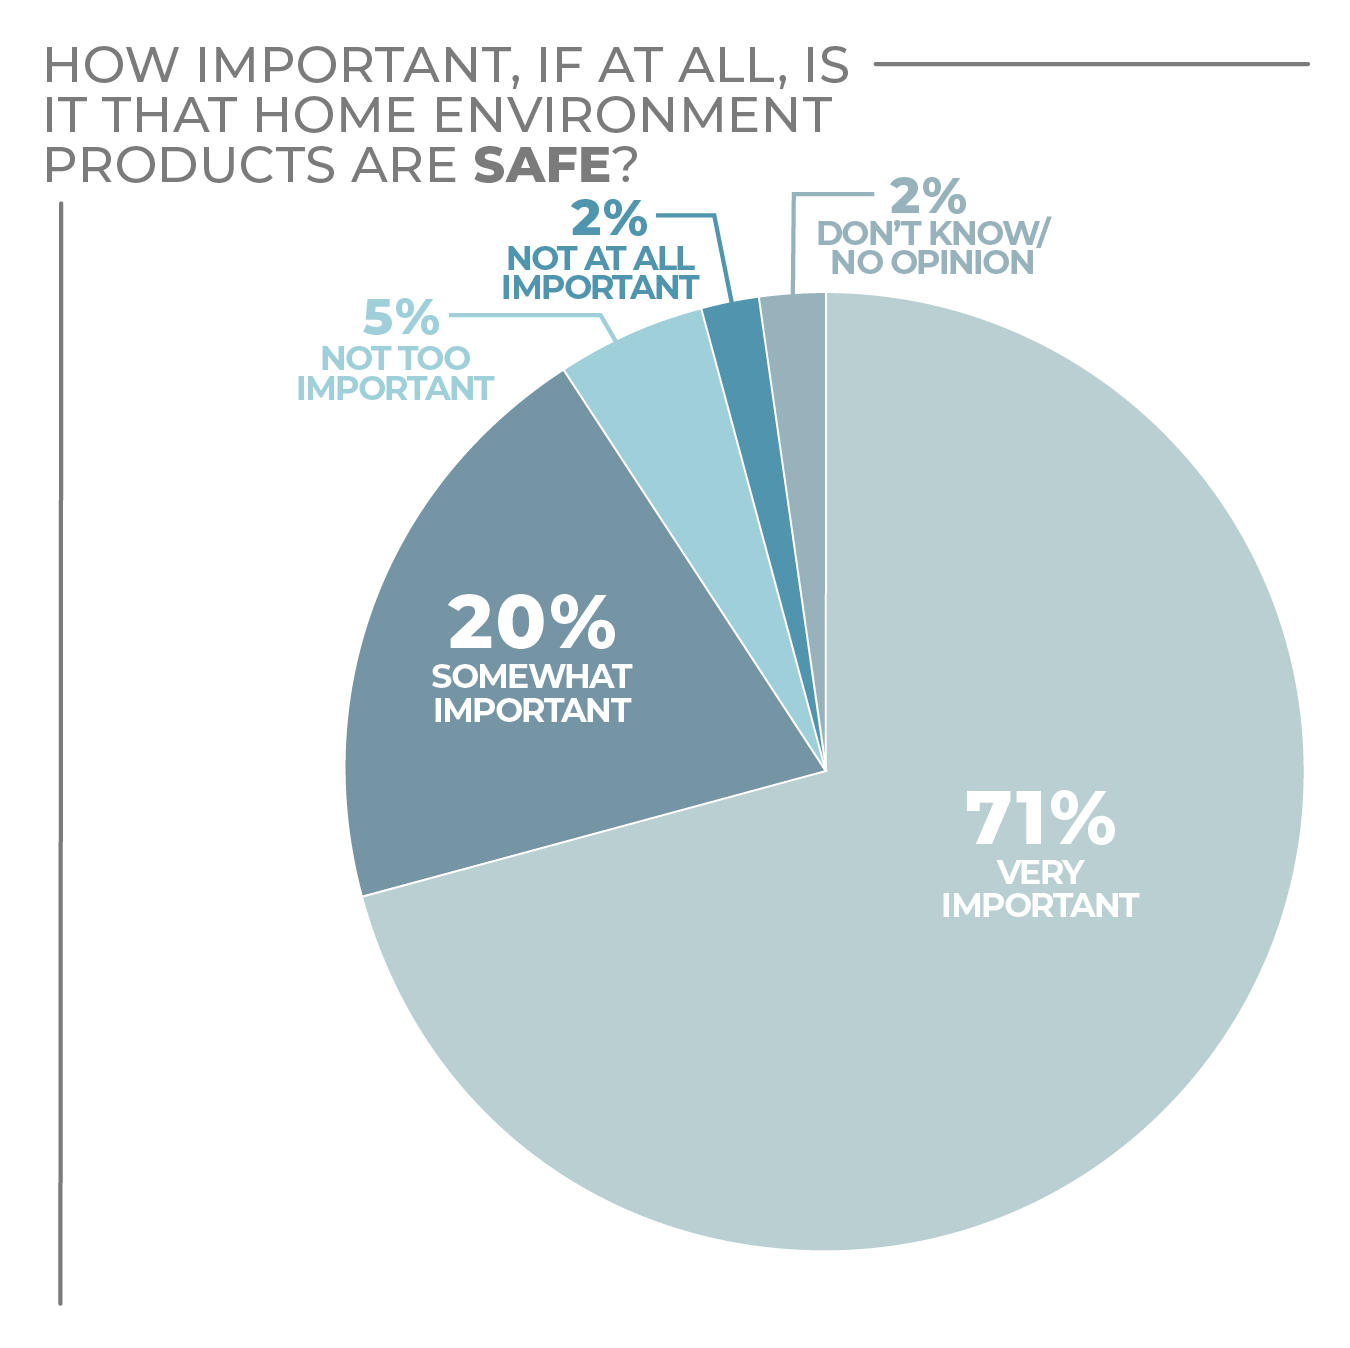
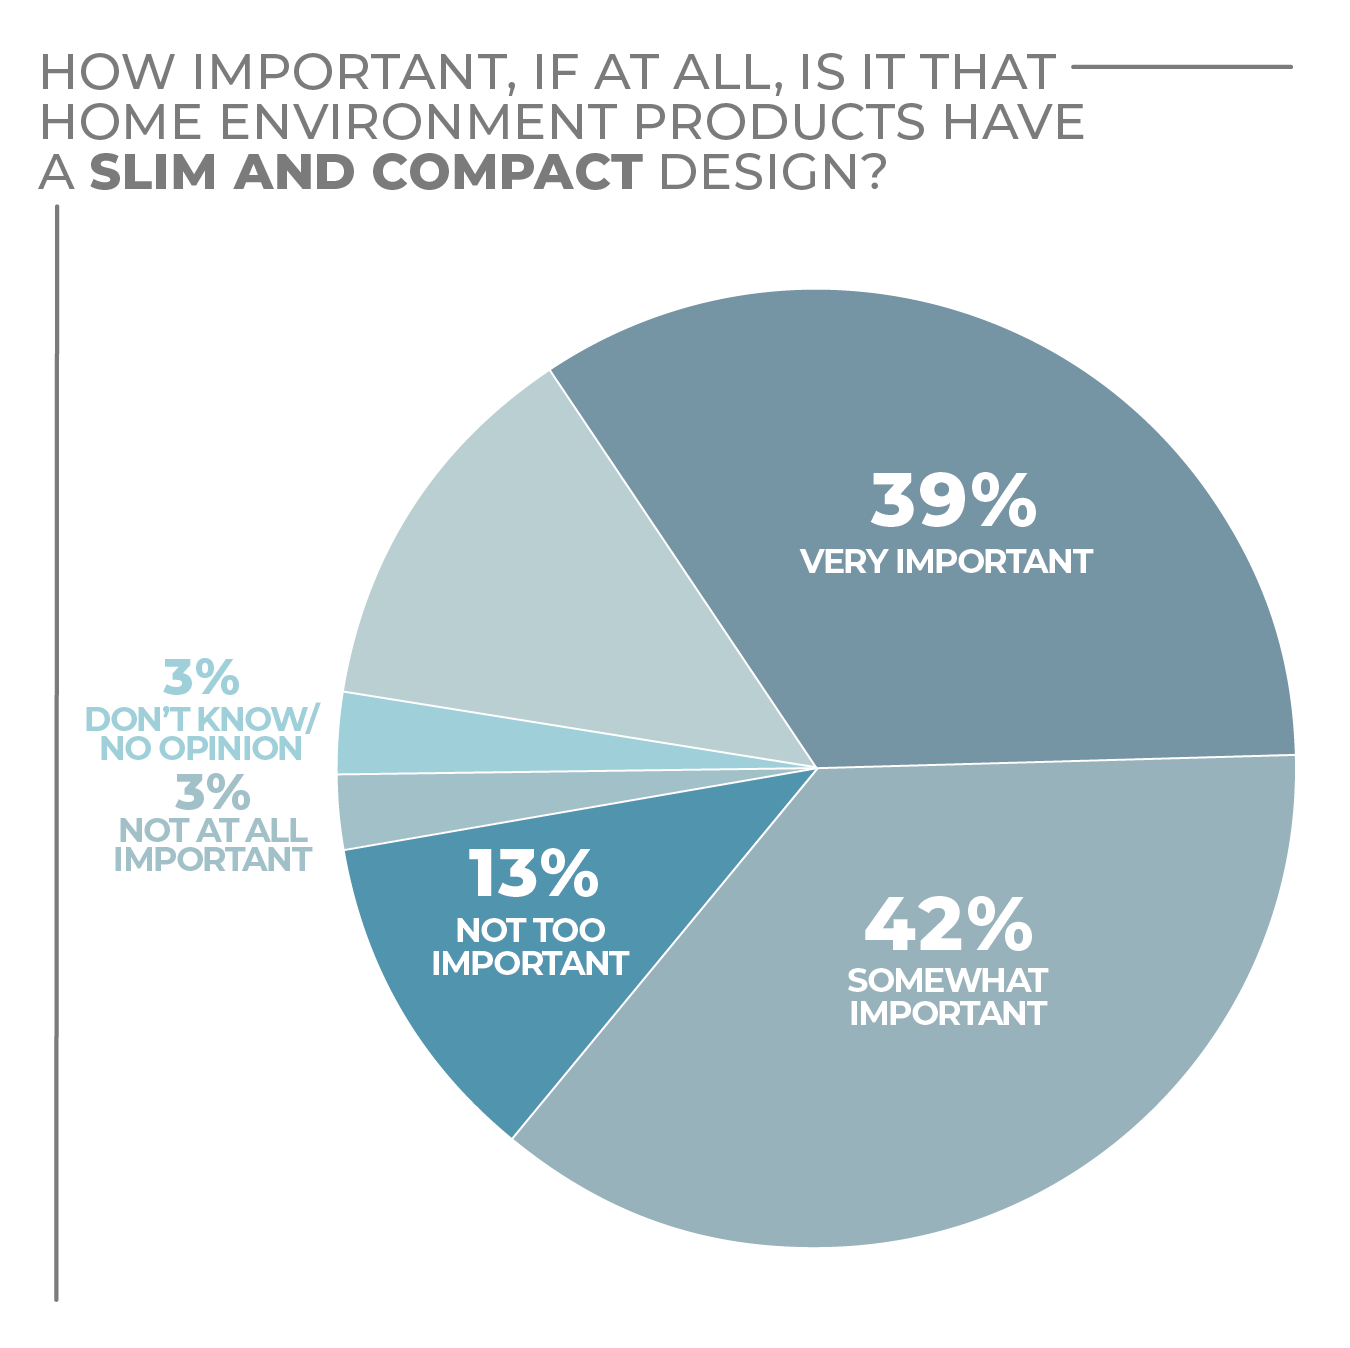
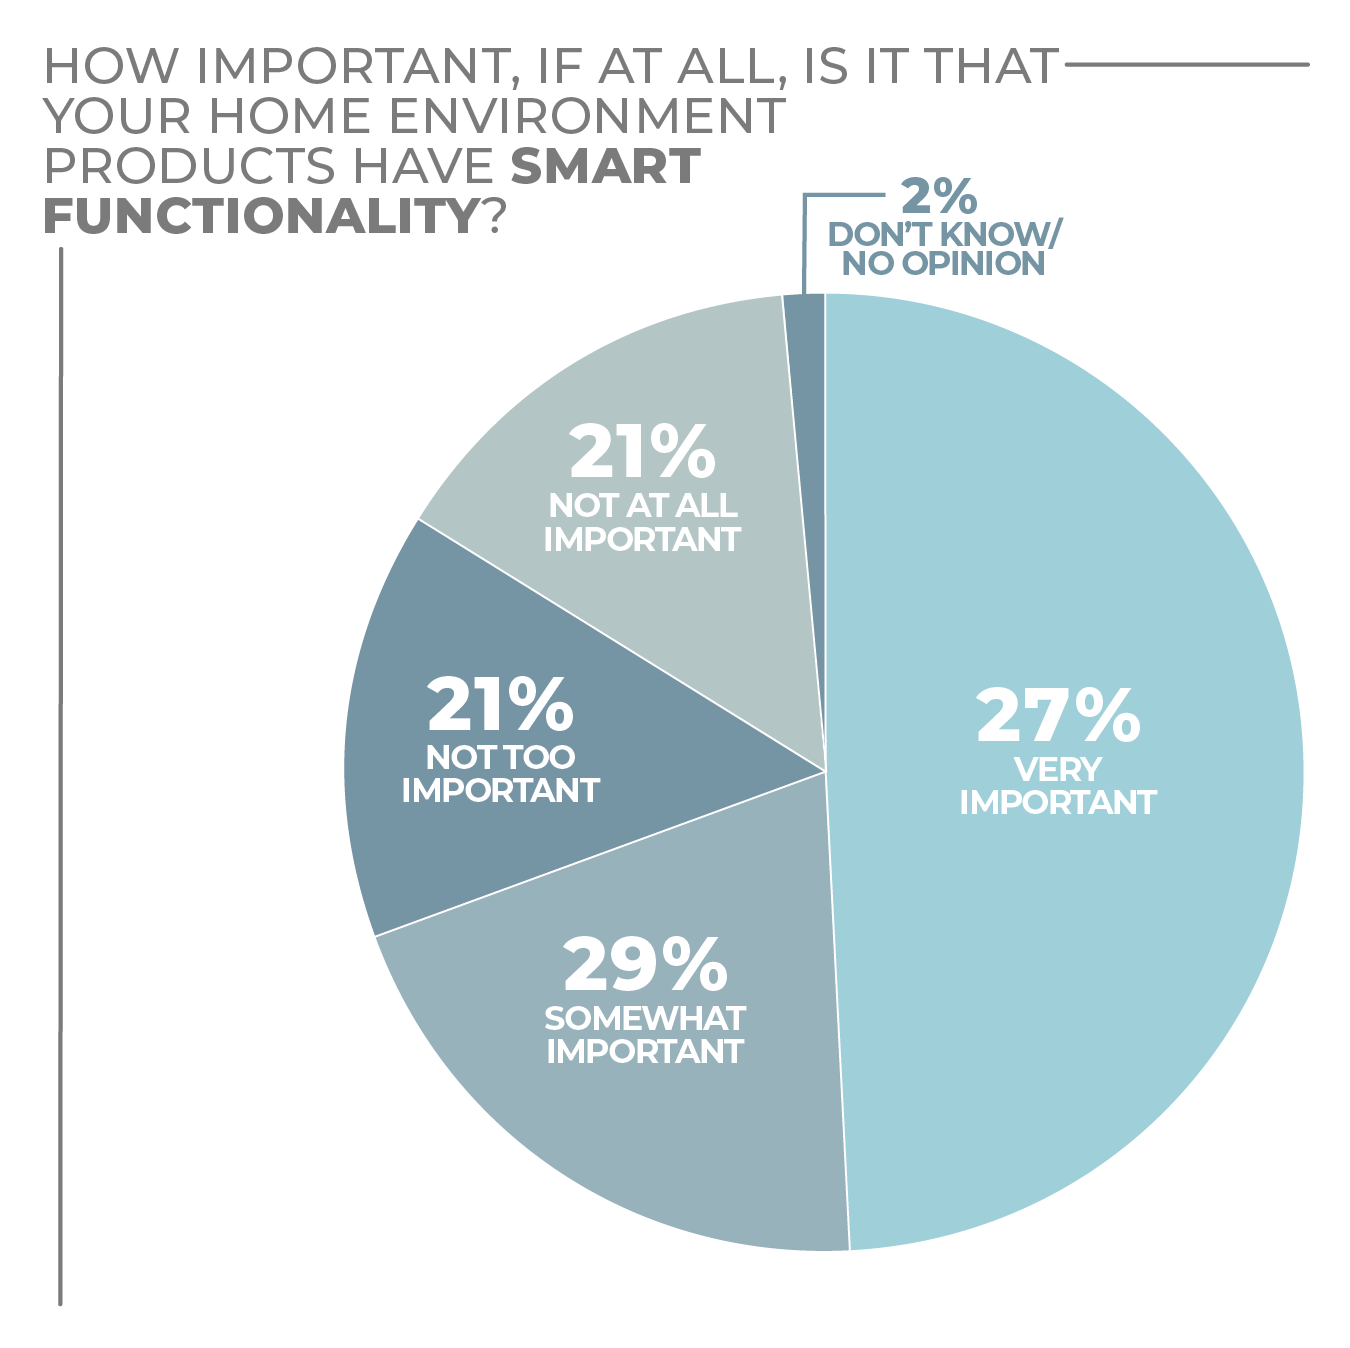
Click on charts to enlarge.
Kitchen Electrics
Although kitchen electrics have been a popular purchase throughout the COVID-19 pandemic, a lot of consumers still are considering purchases in the segment.
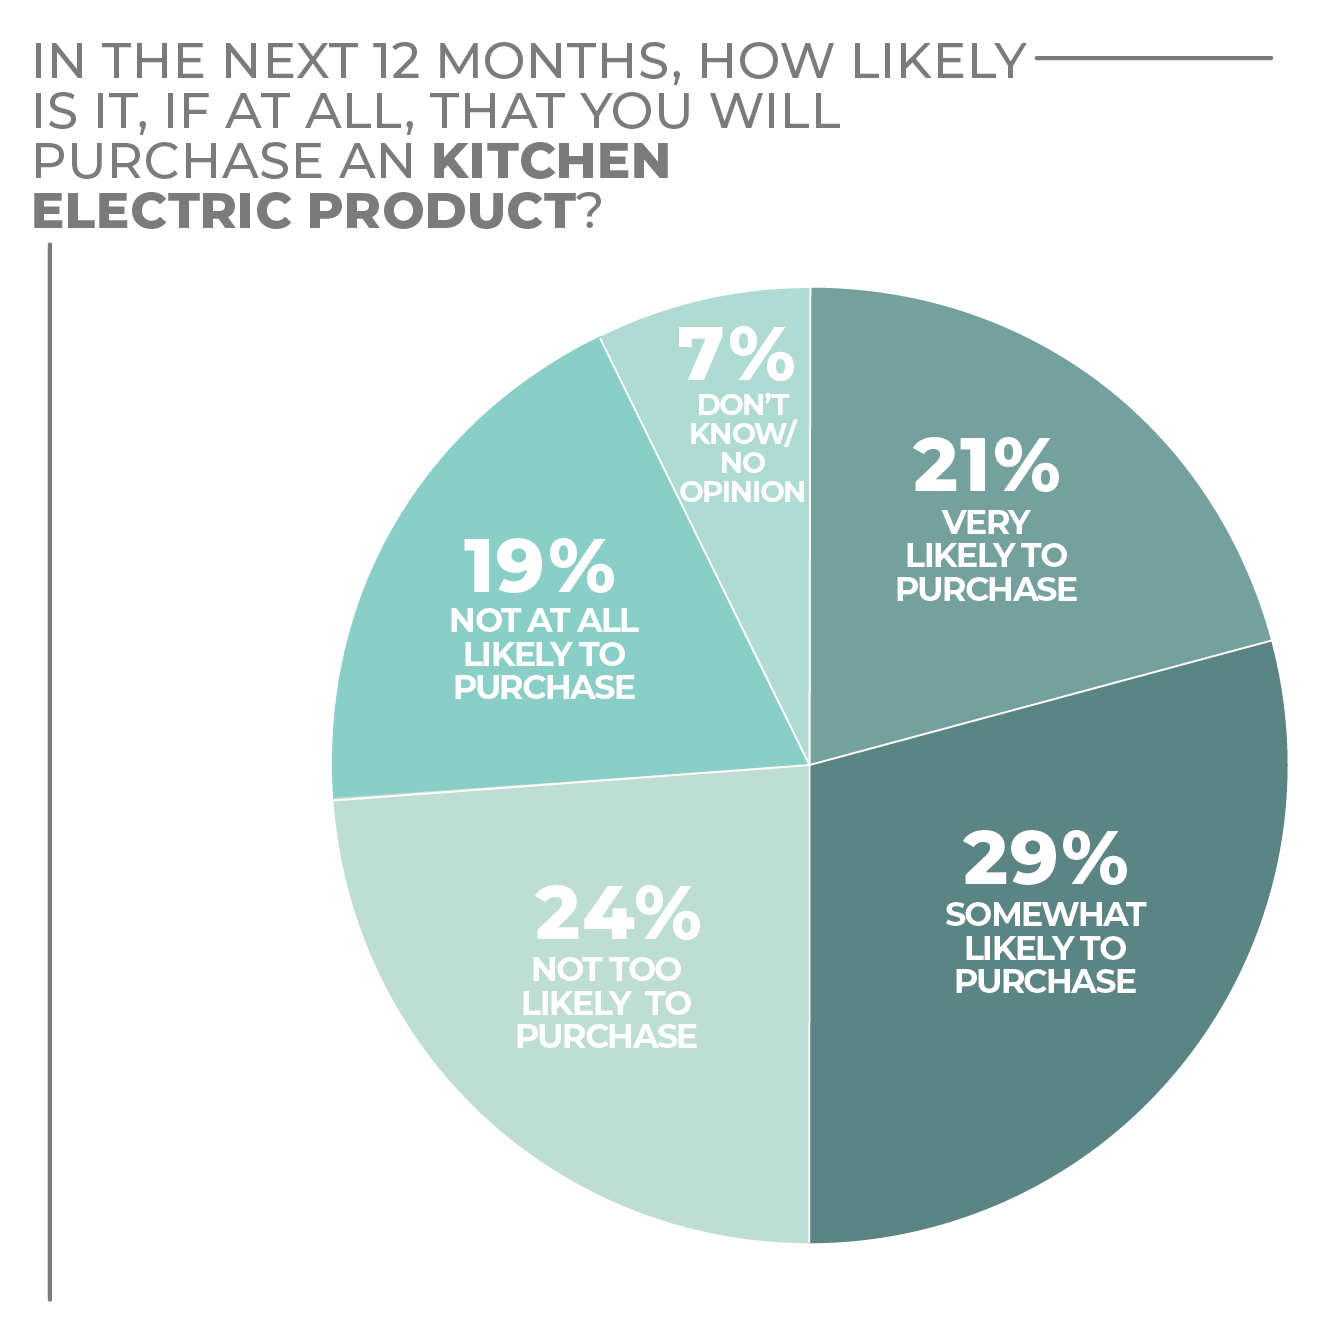
In the HomePage News 2022 Consumer Outlook Survey, 21% of consumers said they are very likely to purchase kitchen electrics, and 29% said they were somewhat likely to purchase.
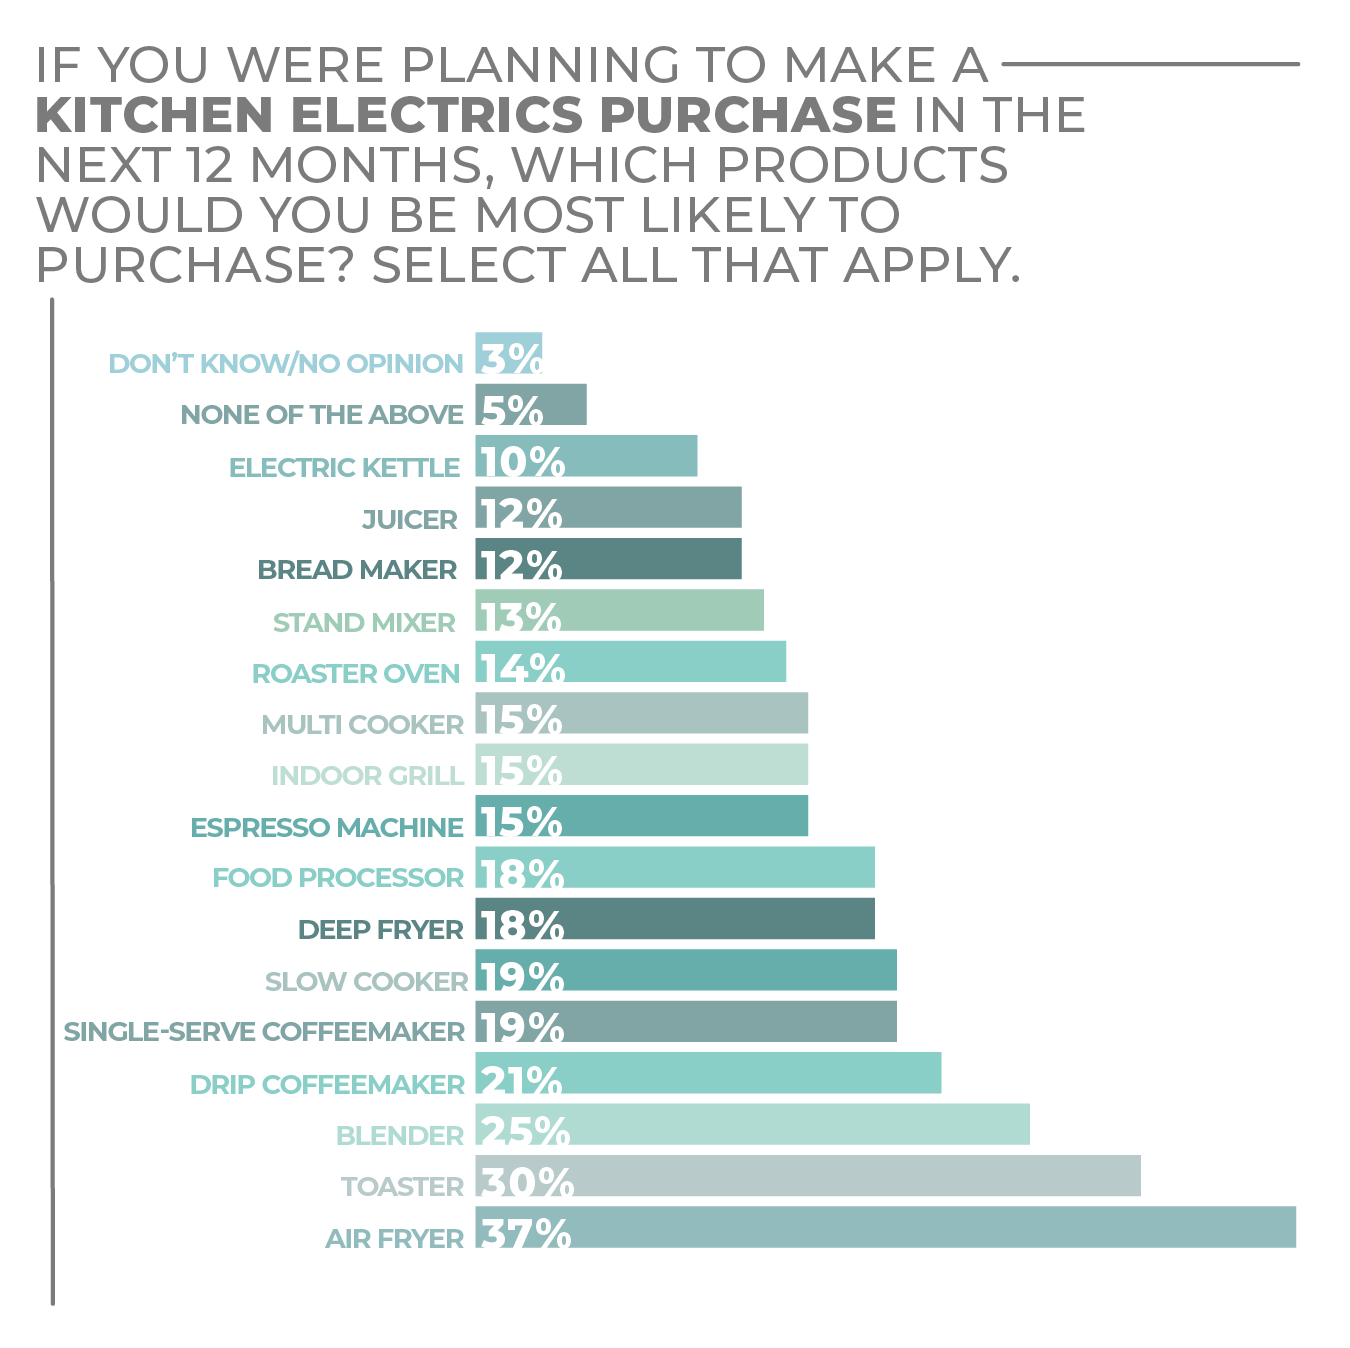
The desire to purchase certainly is driven in part by more cooking at home during the pandemic, which is not only encouraging consumers to do more in the way of food prep but also to learn more about the culinary arts online. The lessons aren’t limited to pots and pans. An entire class of digital videos covers various and often novel ways to use kitchen appliances, with air fryers a prominently featured sub-category.
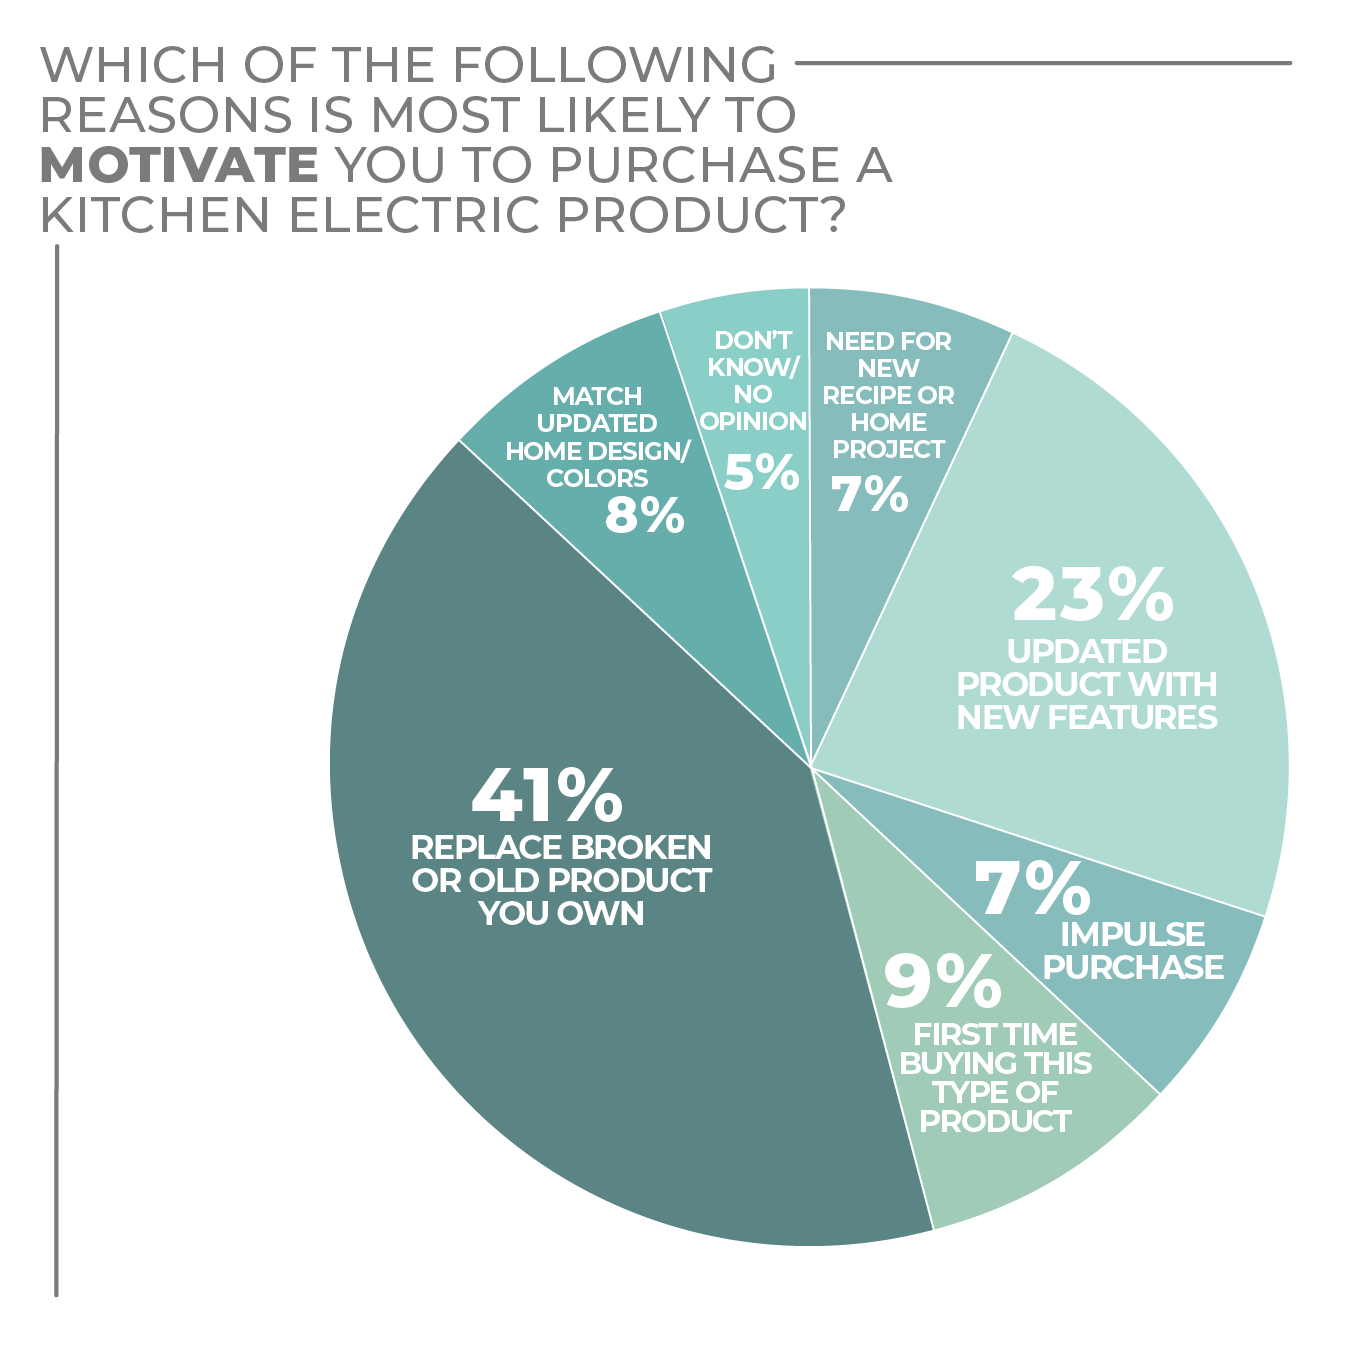
Why buy? Not surprisingly, the top reason, selected by 41% of respondents, is replacement. The second-highest reason, at 23%, is to own a product with updated features. Far behind, at 8%, was the next highest: Match an updated home design or color scheme.
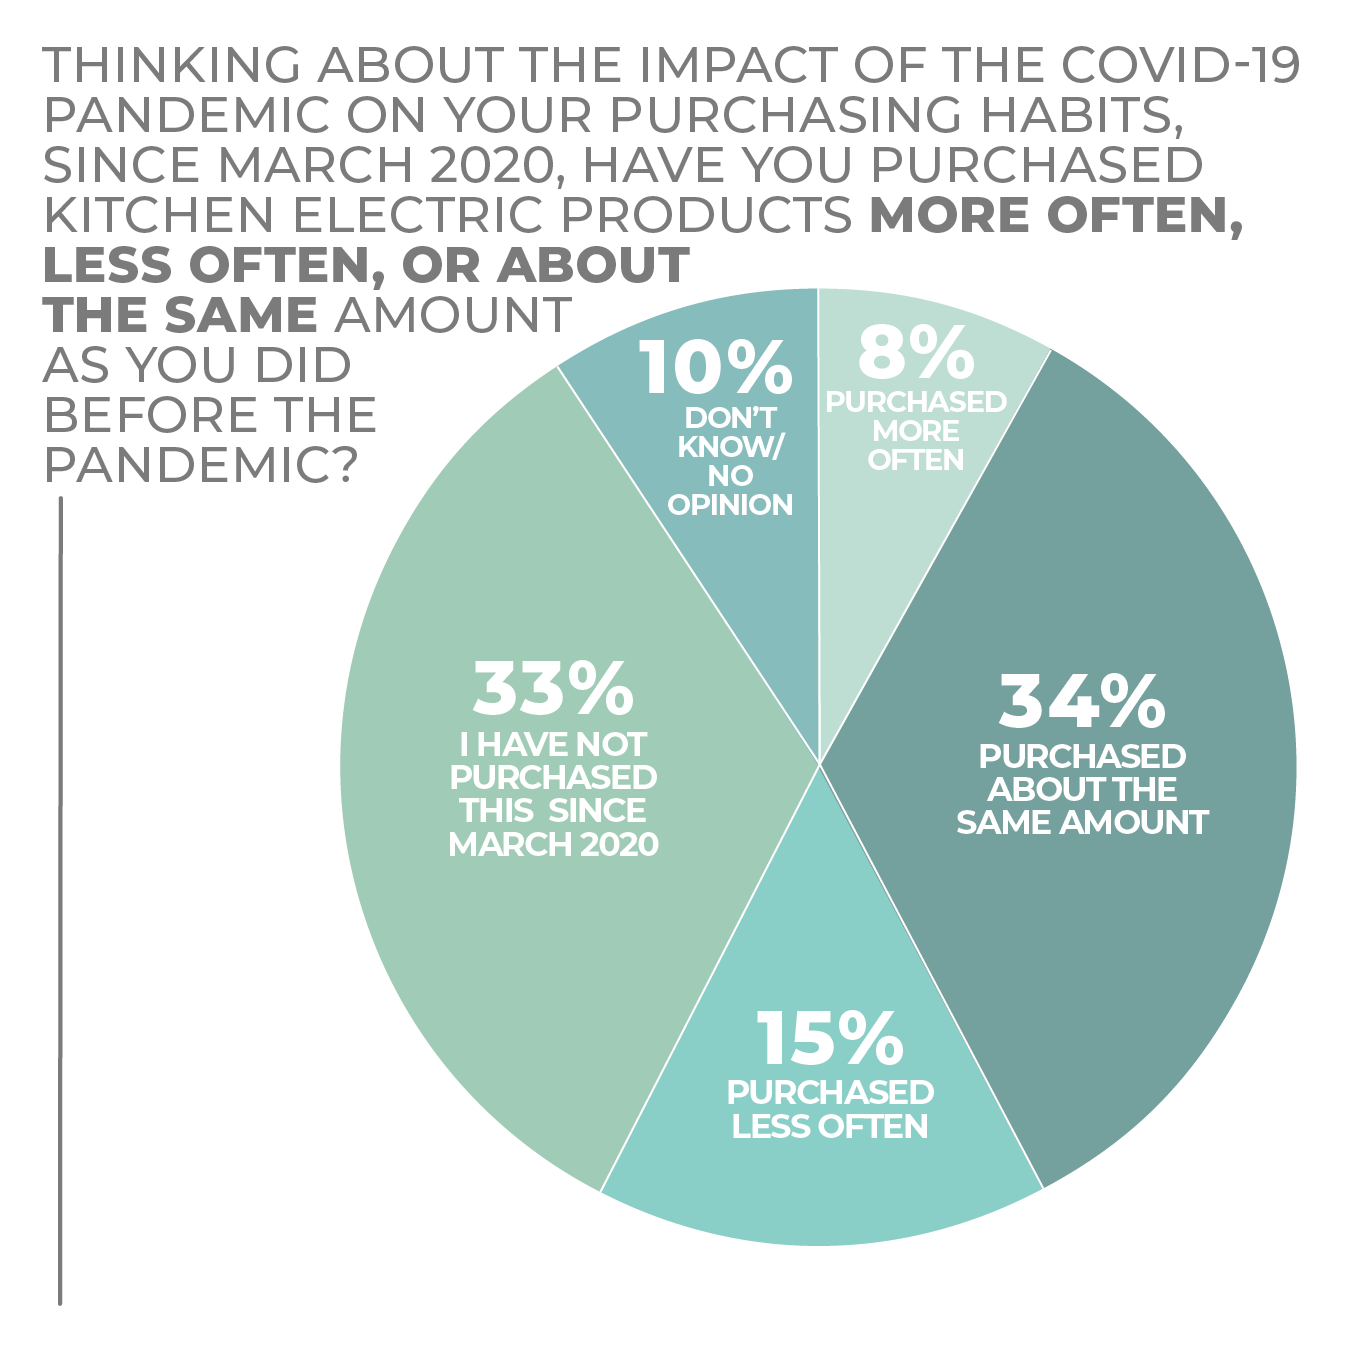
In an interesting response, only 8% of consumers said they purchased kitchen electrics more often during the pandemic, while 34% purchased about the same amount. Some 15% purchased less and 33% didn’t purchase at all since March 2020. Those figures support respondents’ relative enthusiasm to purchase over the next 12 months. It may be time to replace a product or get one with desirable new features.
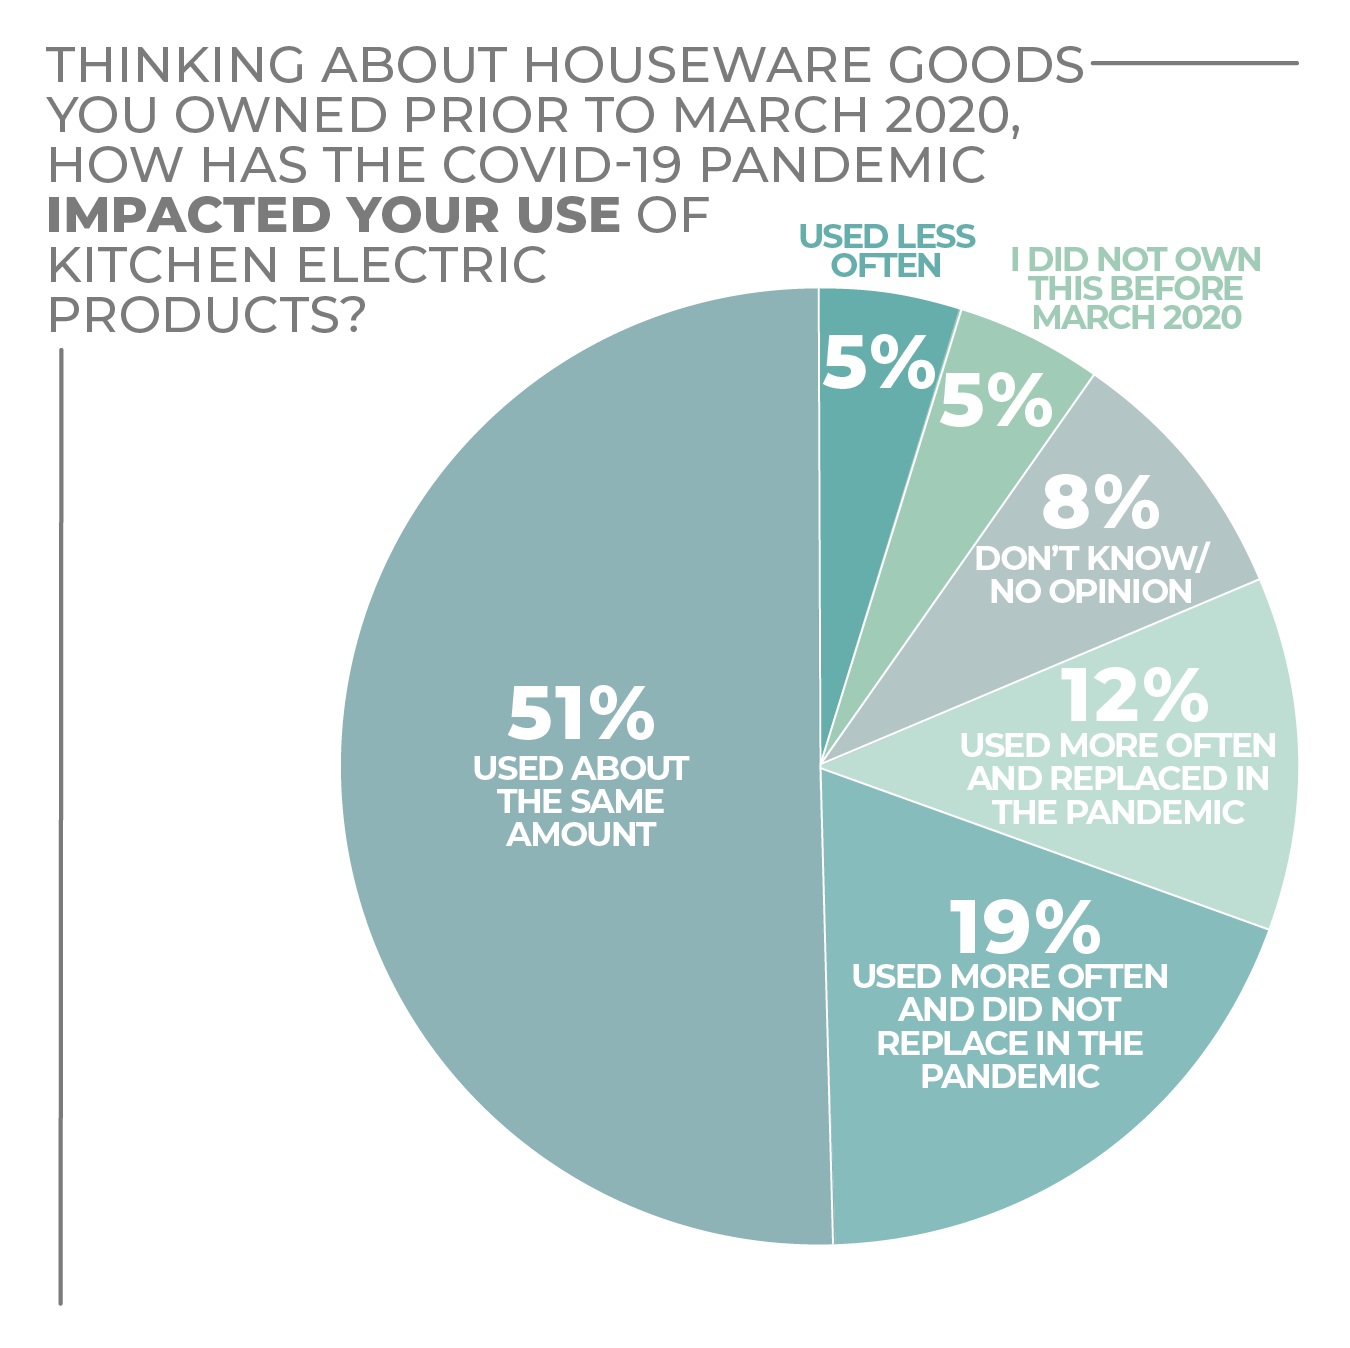
Kitchen electrics got a fair amount of use the past couple of years, as 12% of respondents said they had used them more often and replaced, 19% said they used them more often and didn’t replace, and 51% used about the same amount. Wear and tear may direct their purchase intent in the near future.
Where survey respondents want to purchase leaned toward traditional retailers, with only 10% saying they would prefer to research online and purchase from an online-only merchant website.
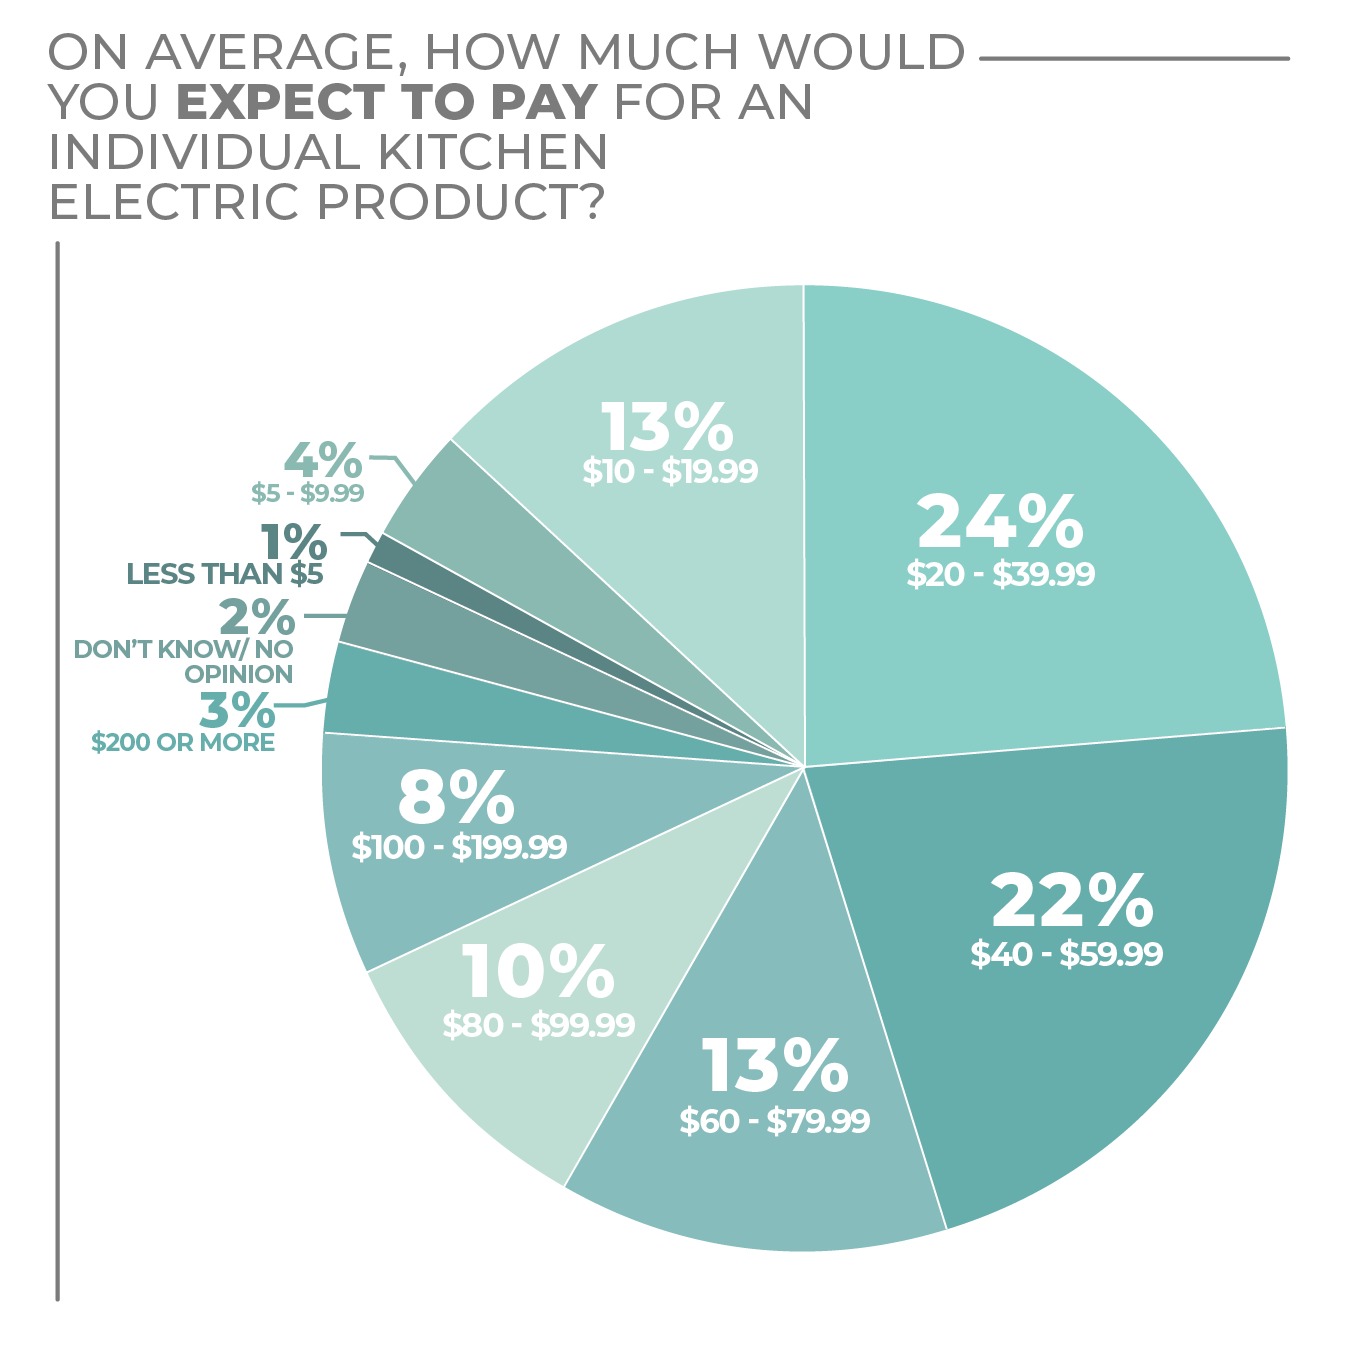
The price consumers are willing to pay for a kitchen electric product covers a wide range. Few survey respondents expected to pay less than $10, only about 5% total. Only about 11% were interested in paying $100 or more. Just less than half of the consumers responding to the survey were most comfortable with prices between $20 and $59.99.
Men and women are similar in their consideration of a kitchen electrics purchase. As for the generations, Millennials led with 29% very likely and 33% somewhat likely to purchase. Gen Xers and Gen Zers were pretty enthusiastic, too, with 21% and 23% very likely and 31% and 26% somewhat likely to buy, respectively, in the product segment. Considering the relatively young age of Gen Zers, born between 1997 and 2012, their readiness to purchase is at least a little noteworthy.
As for geography, survey respondents in the Northeast were most likely to say they were very likely to purchase, with the other three regions tied at 20%. The Northeast and South tied for the highest potential demand in the somewhat likely response at 30% followed by the West at 29% and the Midwest at 27%.
More Kitchen Electrics Findings:

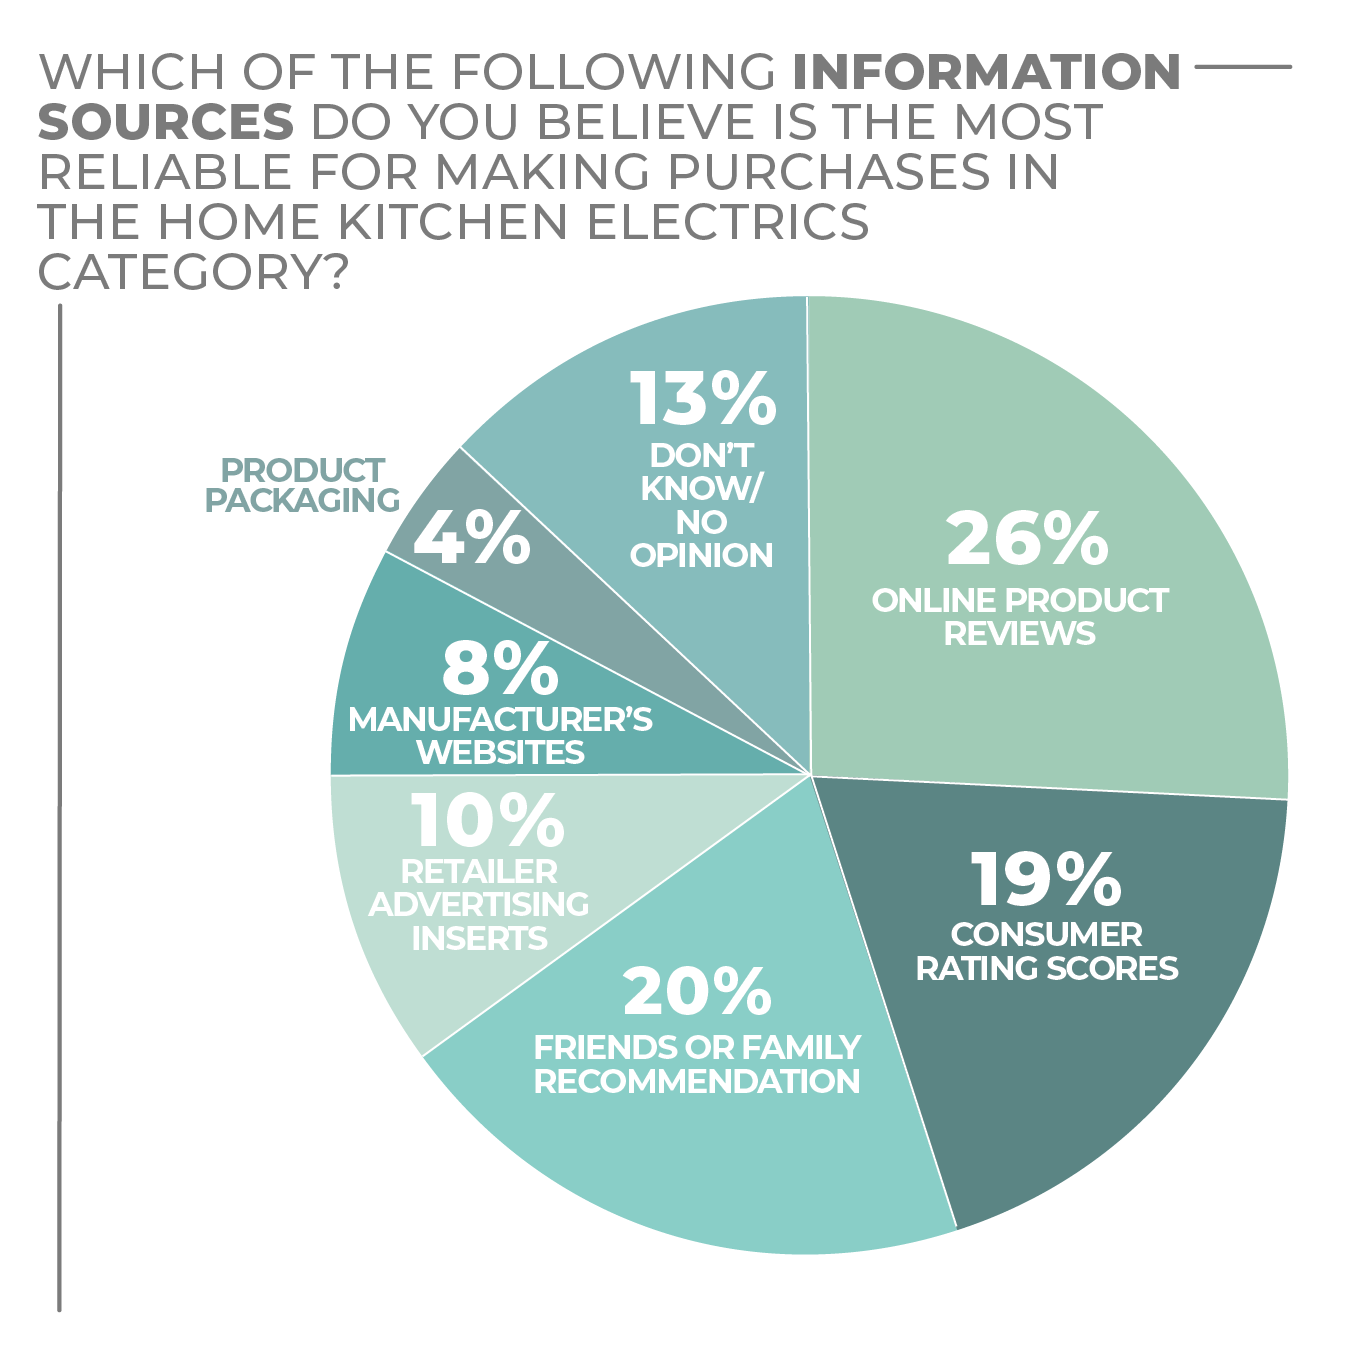
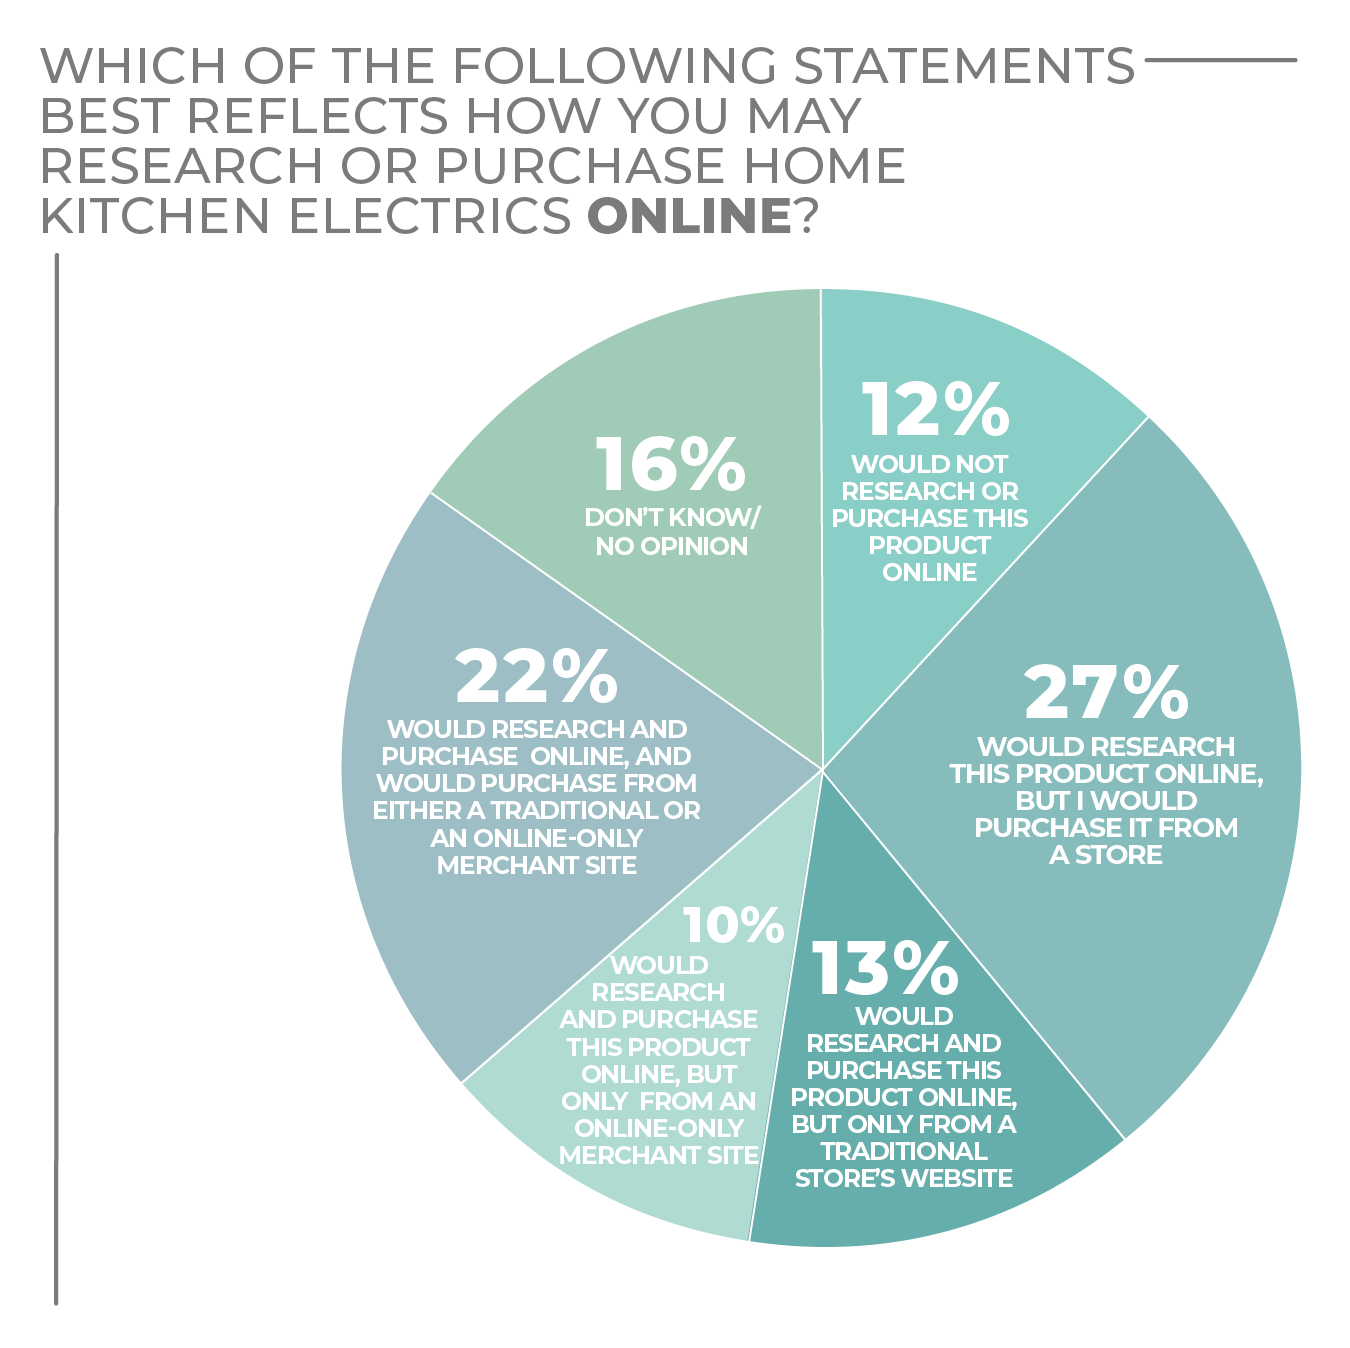
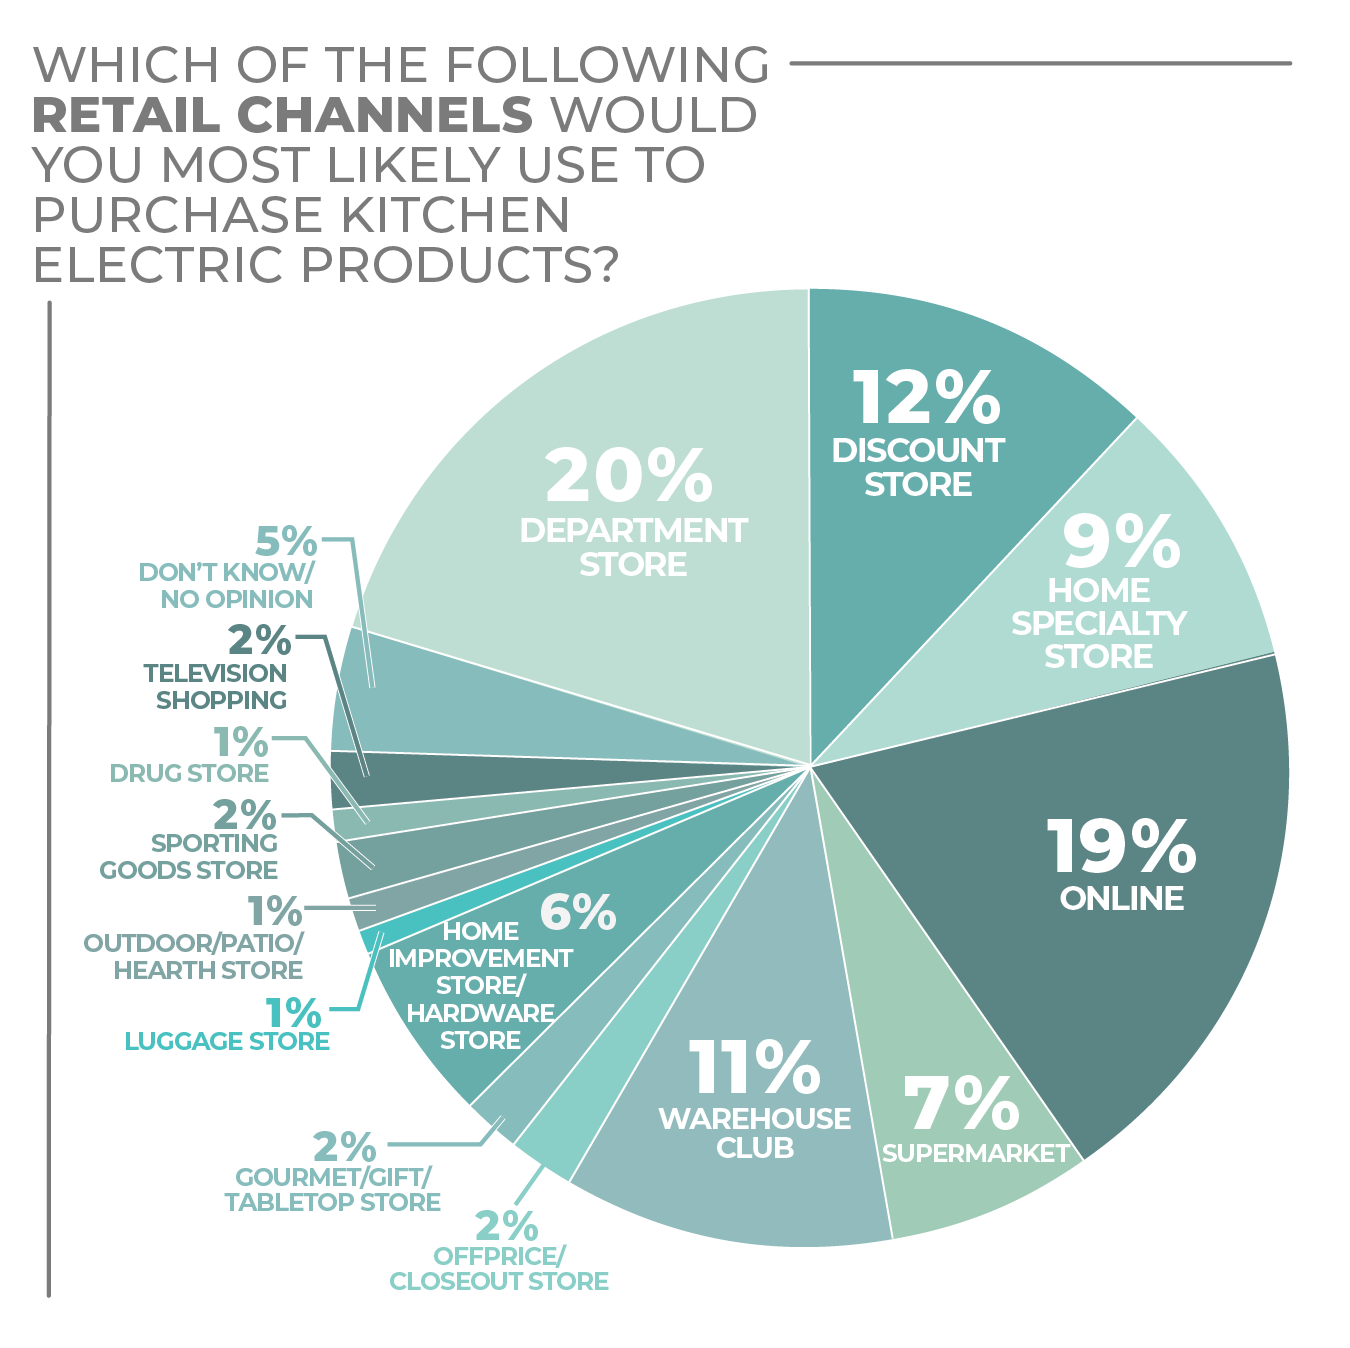
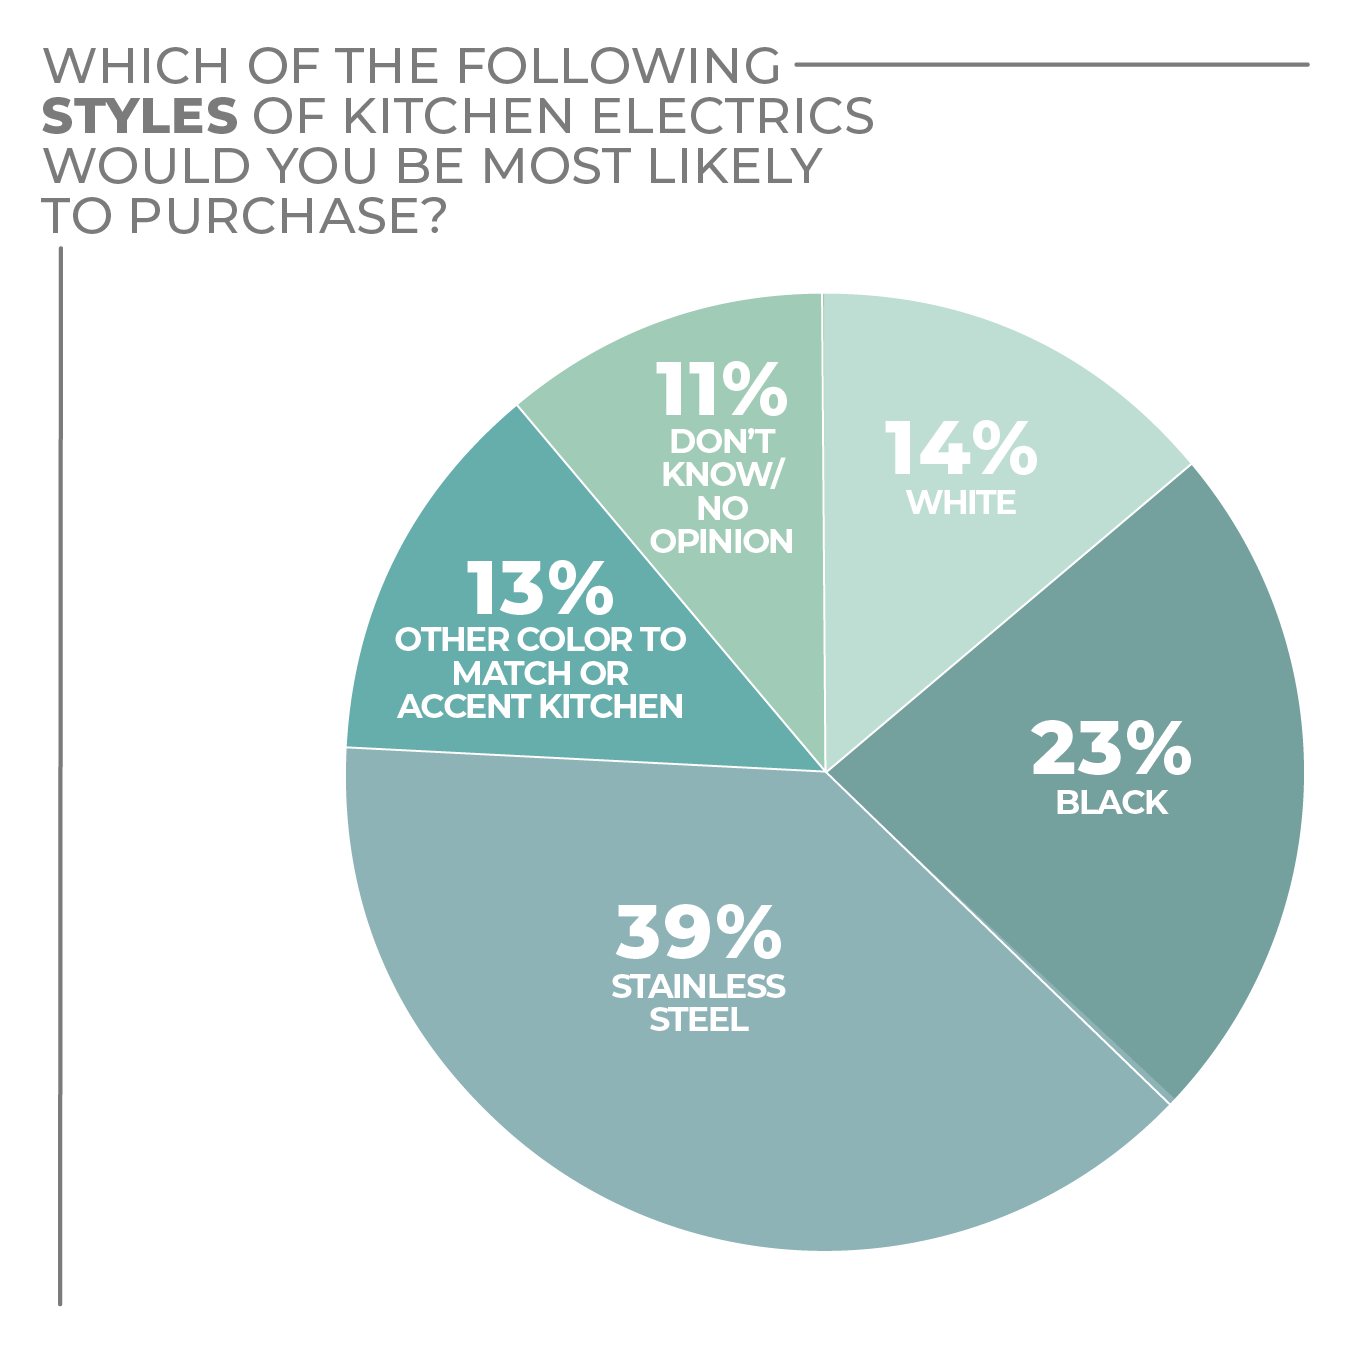
Click on charts to enlarge.
Kitchen Textiles
Consumers for several decades have been increasingly looking at kitchen textiles as an inexpensive way to make homes more stylish and seasonably appropriate while adding improved quality and performance. Better-quality products have become less expensive, as has happened across the range of home textiles, giving consumers a low-cost means of enlivening their kitchens.
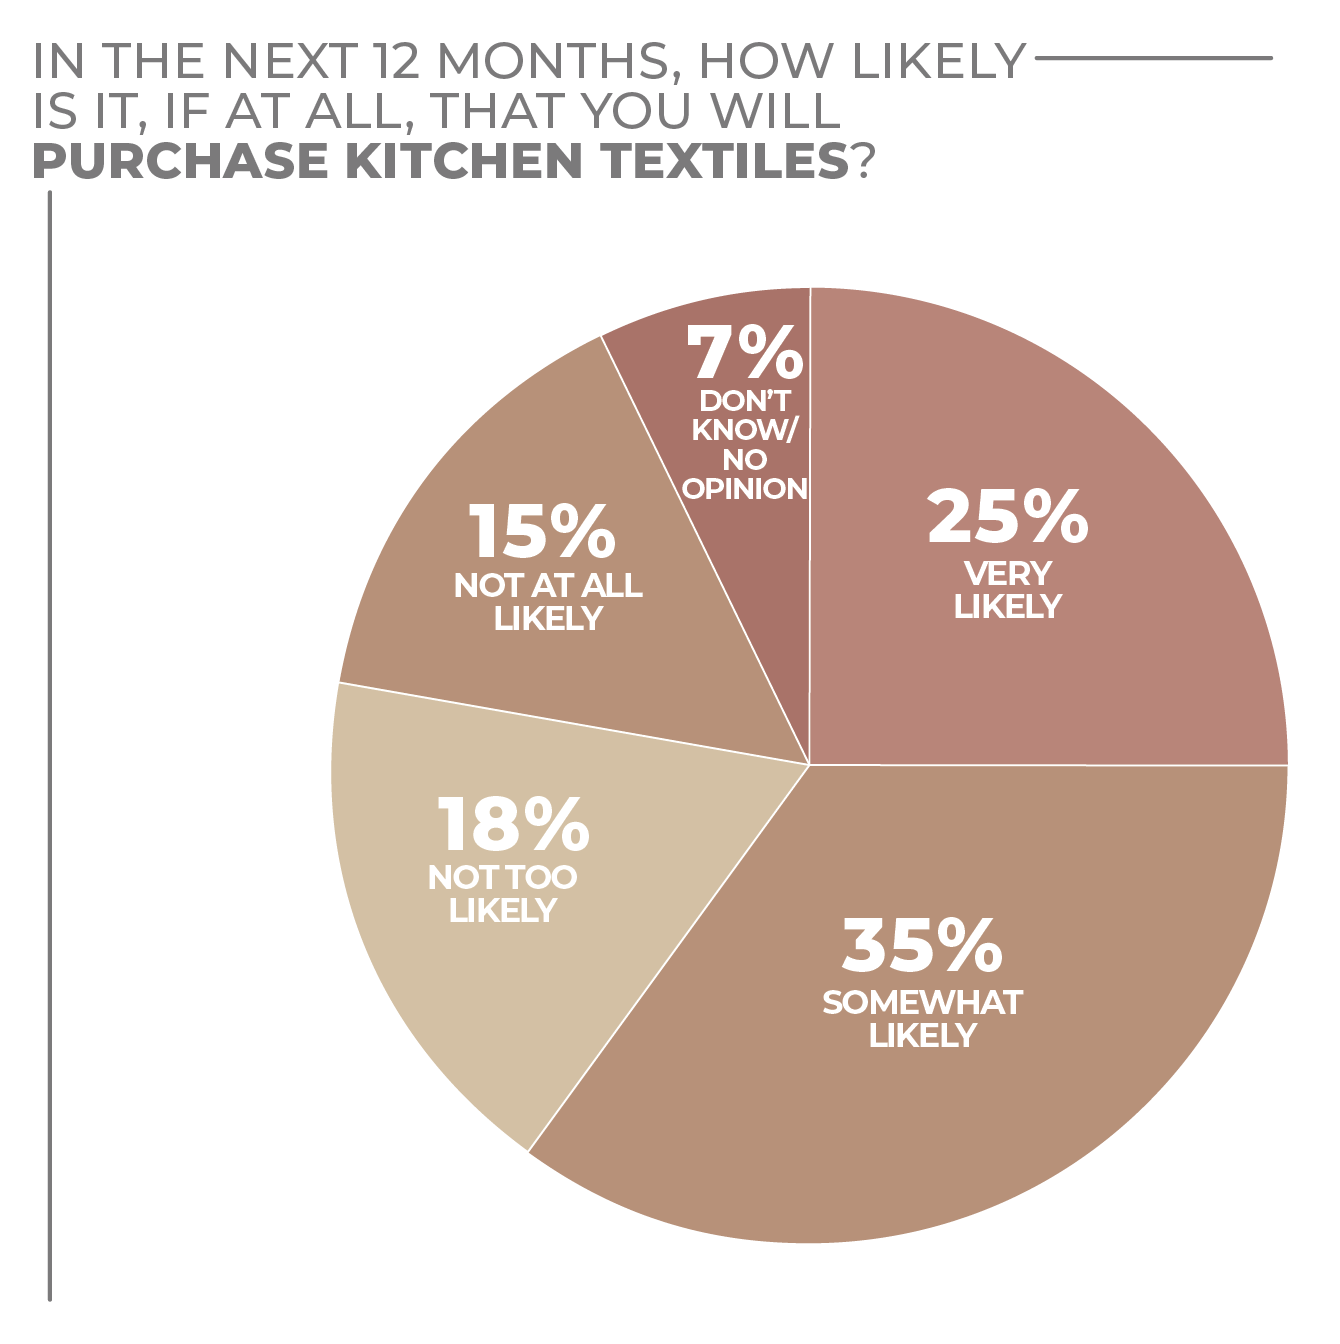
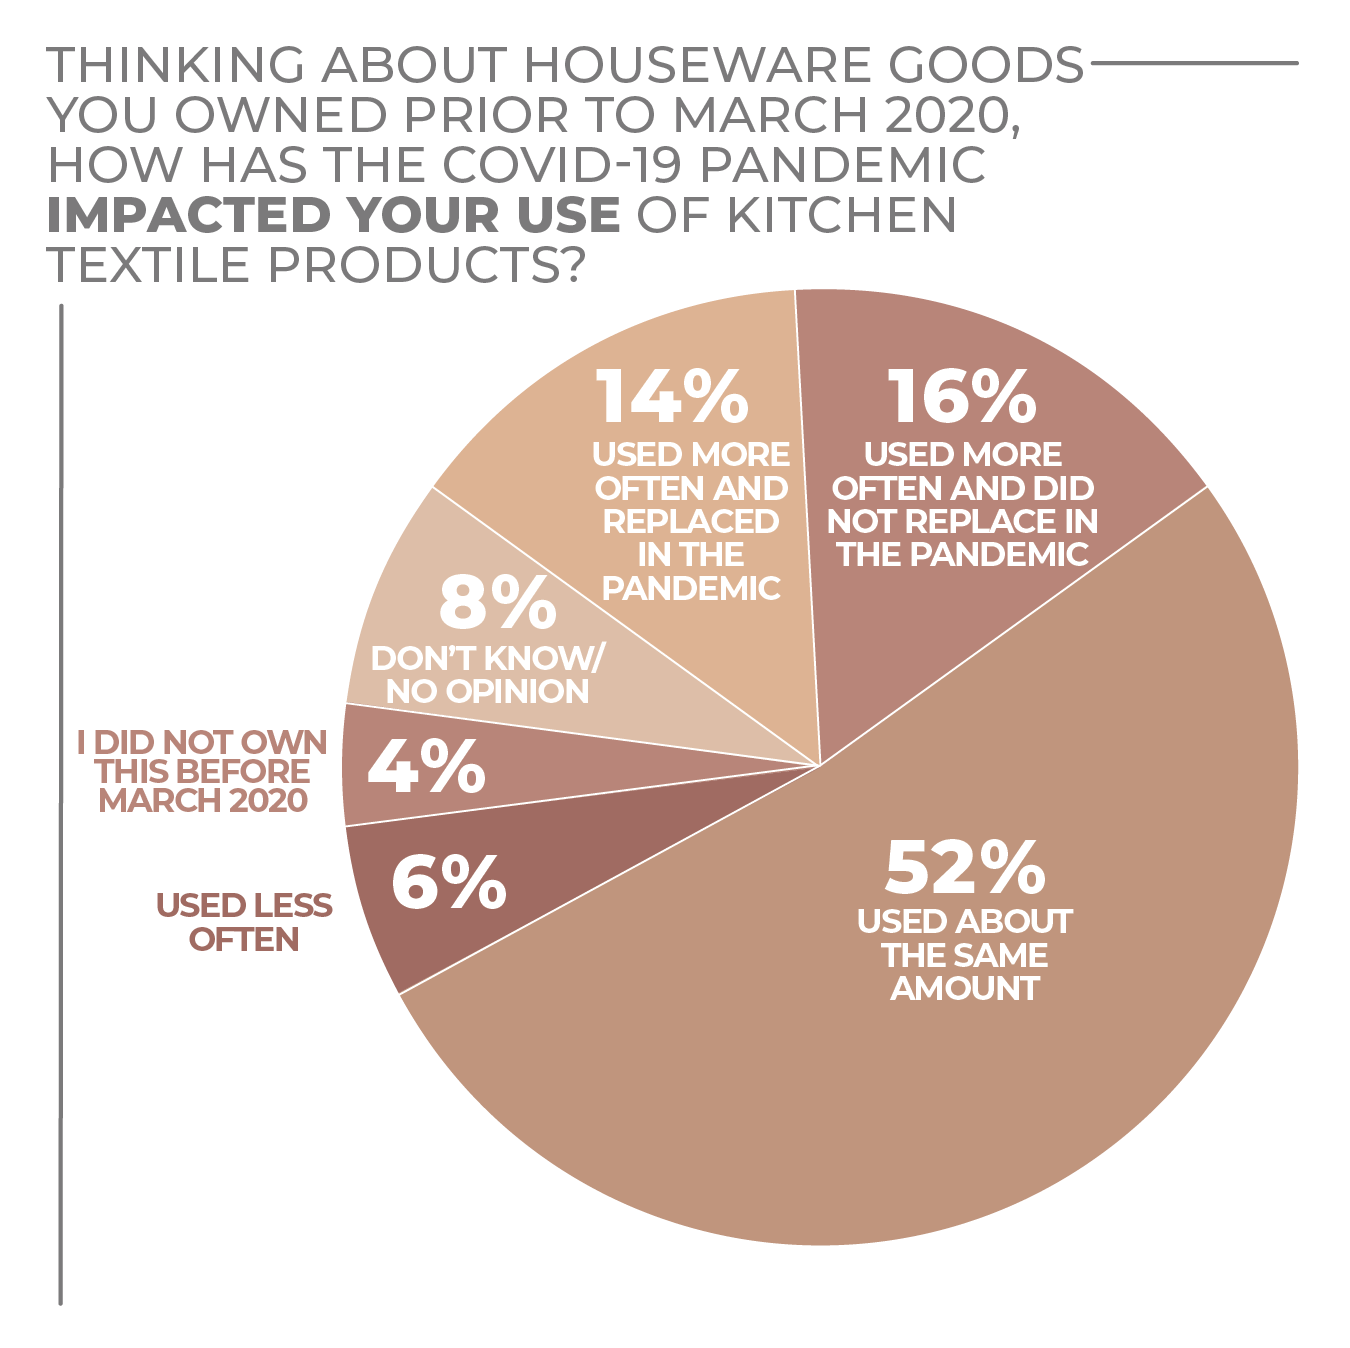
In the HomePage News 2022 Consumer Outlook Survey, more than half of respondents said they are very likely or somewhat likely to make a kitchen textiles purchase over the next 12 months. To the extent that consumers have been purchasing more kitchen textiles during the past year and a half, the desire to keep purchasing seems tied to recently amplified cooking, serving and cleaning habits that are expected to endure beyond the pandemic. For the foreseeable future, kitchen textiles growth prospects seem strong.
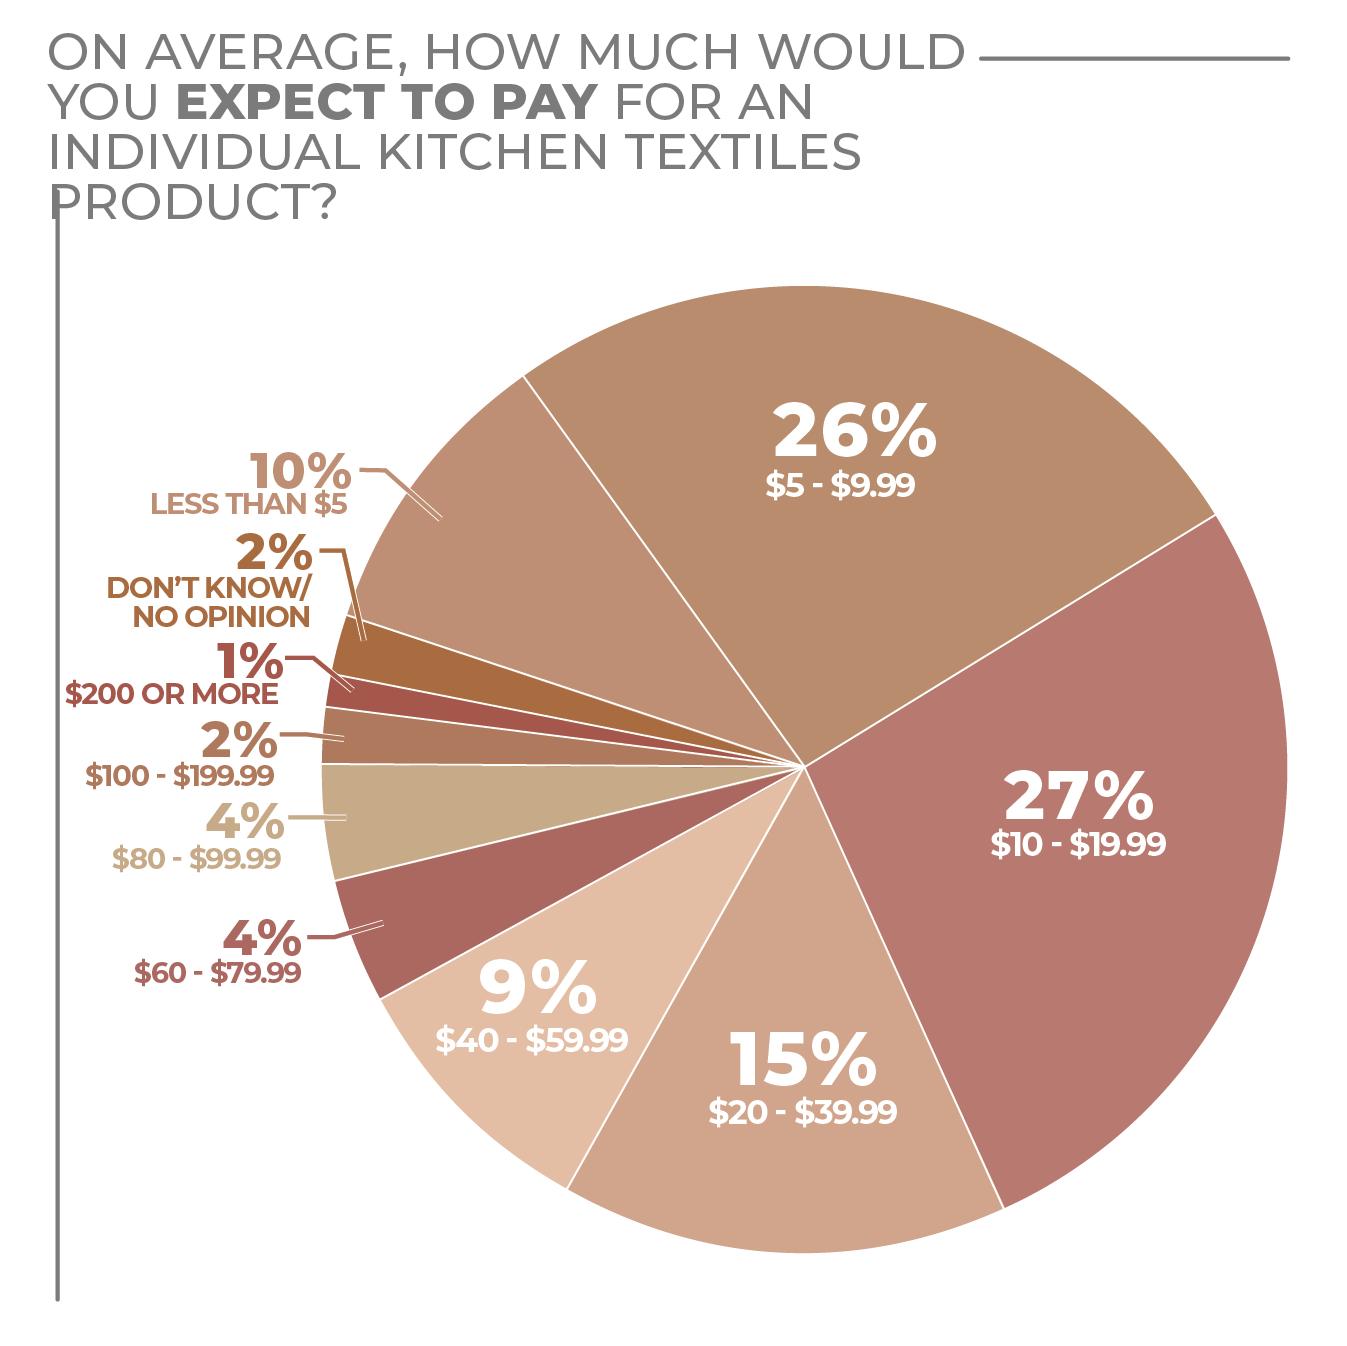
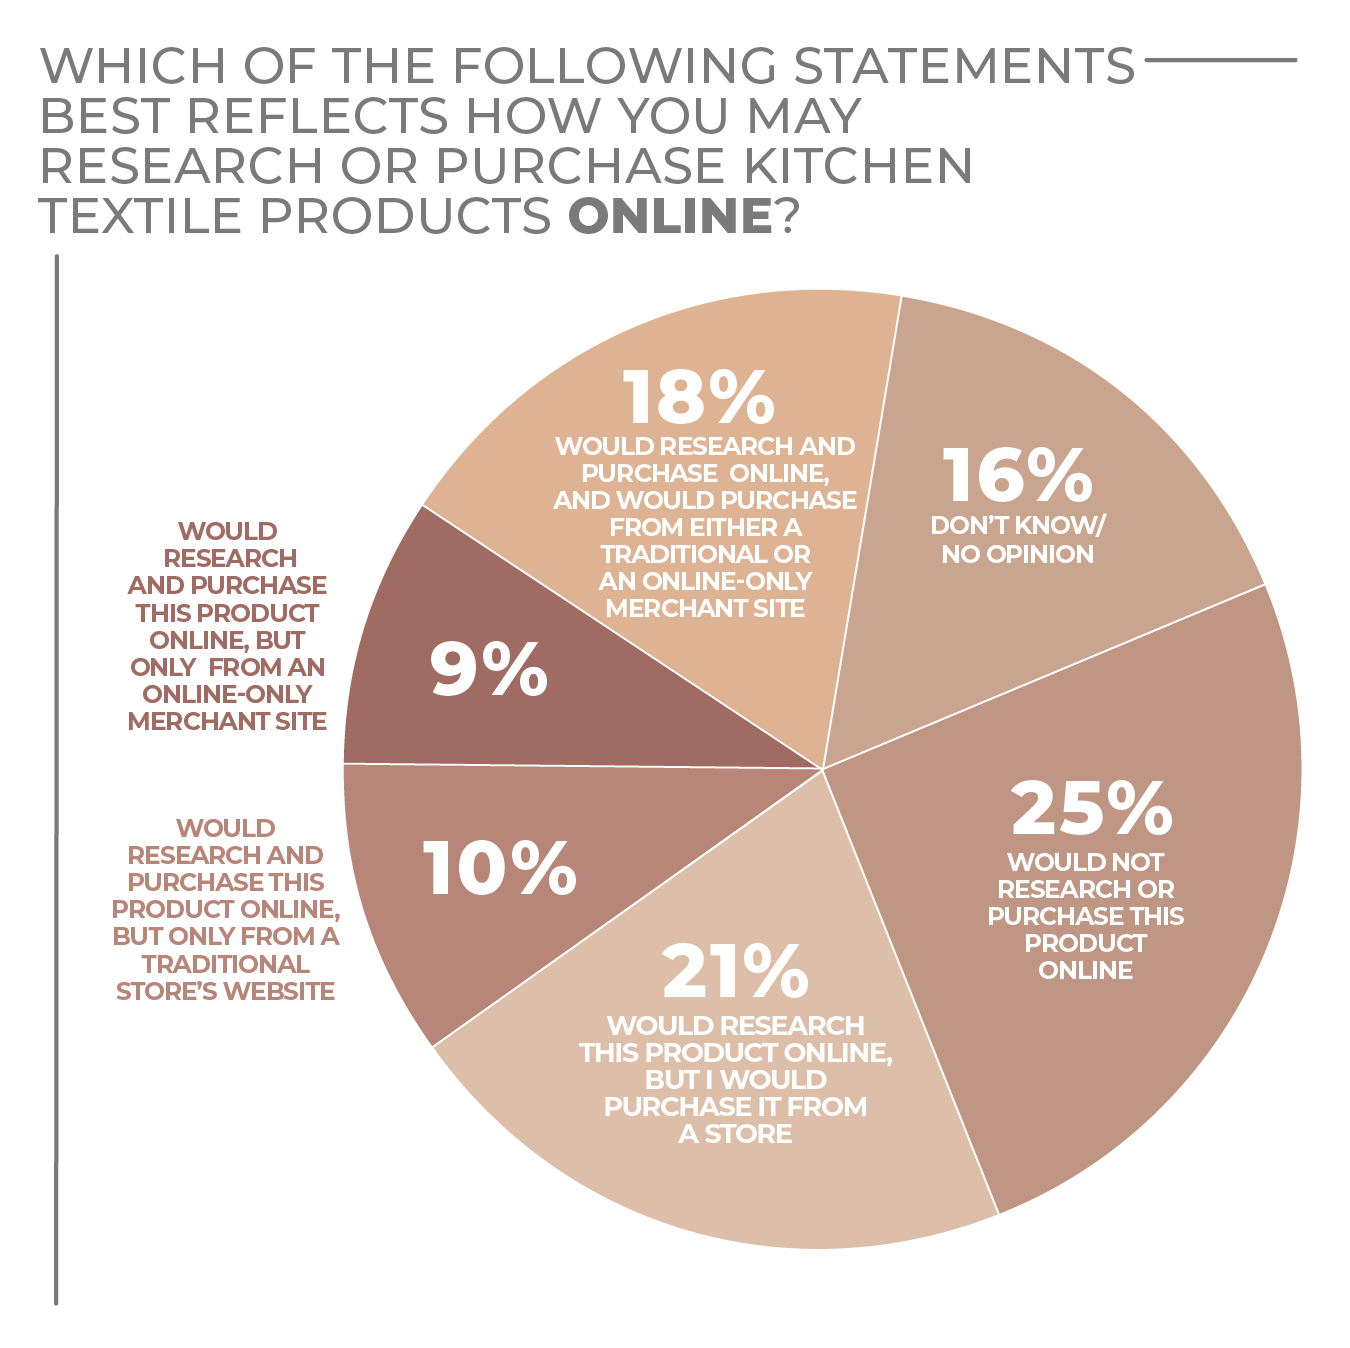
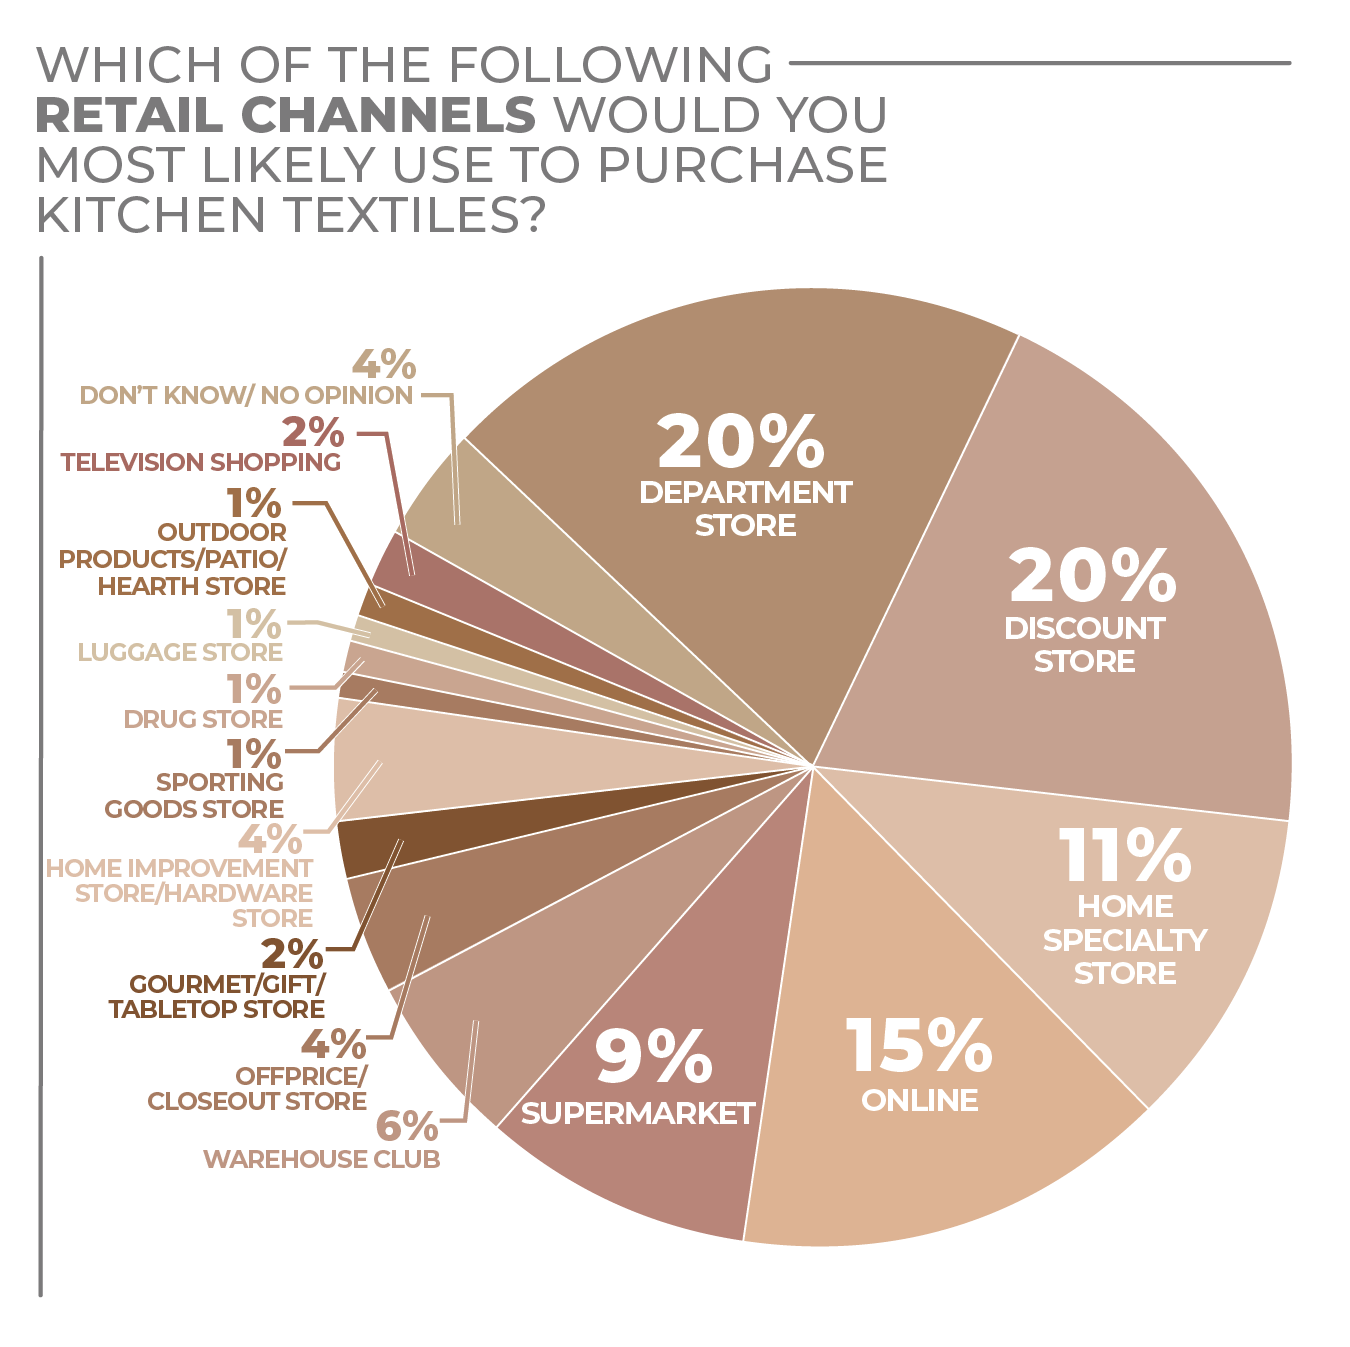
Consumers seem to want to take advantage of the quality that relatively low-priced kitchen textiles have achieved, as more than half of survey respondents said they would spend between $5 and $19.99 on any individual item in the product category. Perhaps surprisingly, given the ease of at-home purchasing, more consumers pick department and discount stores as the place they would most likely purchase kitchen textiles than they do online retailers.
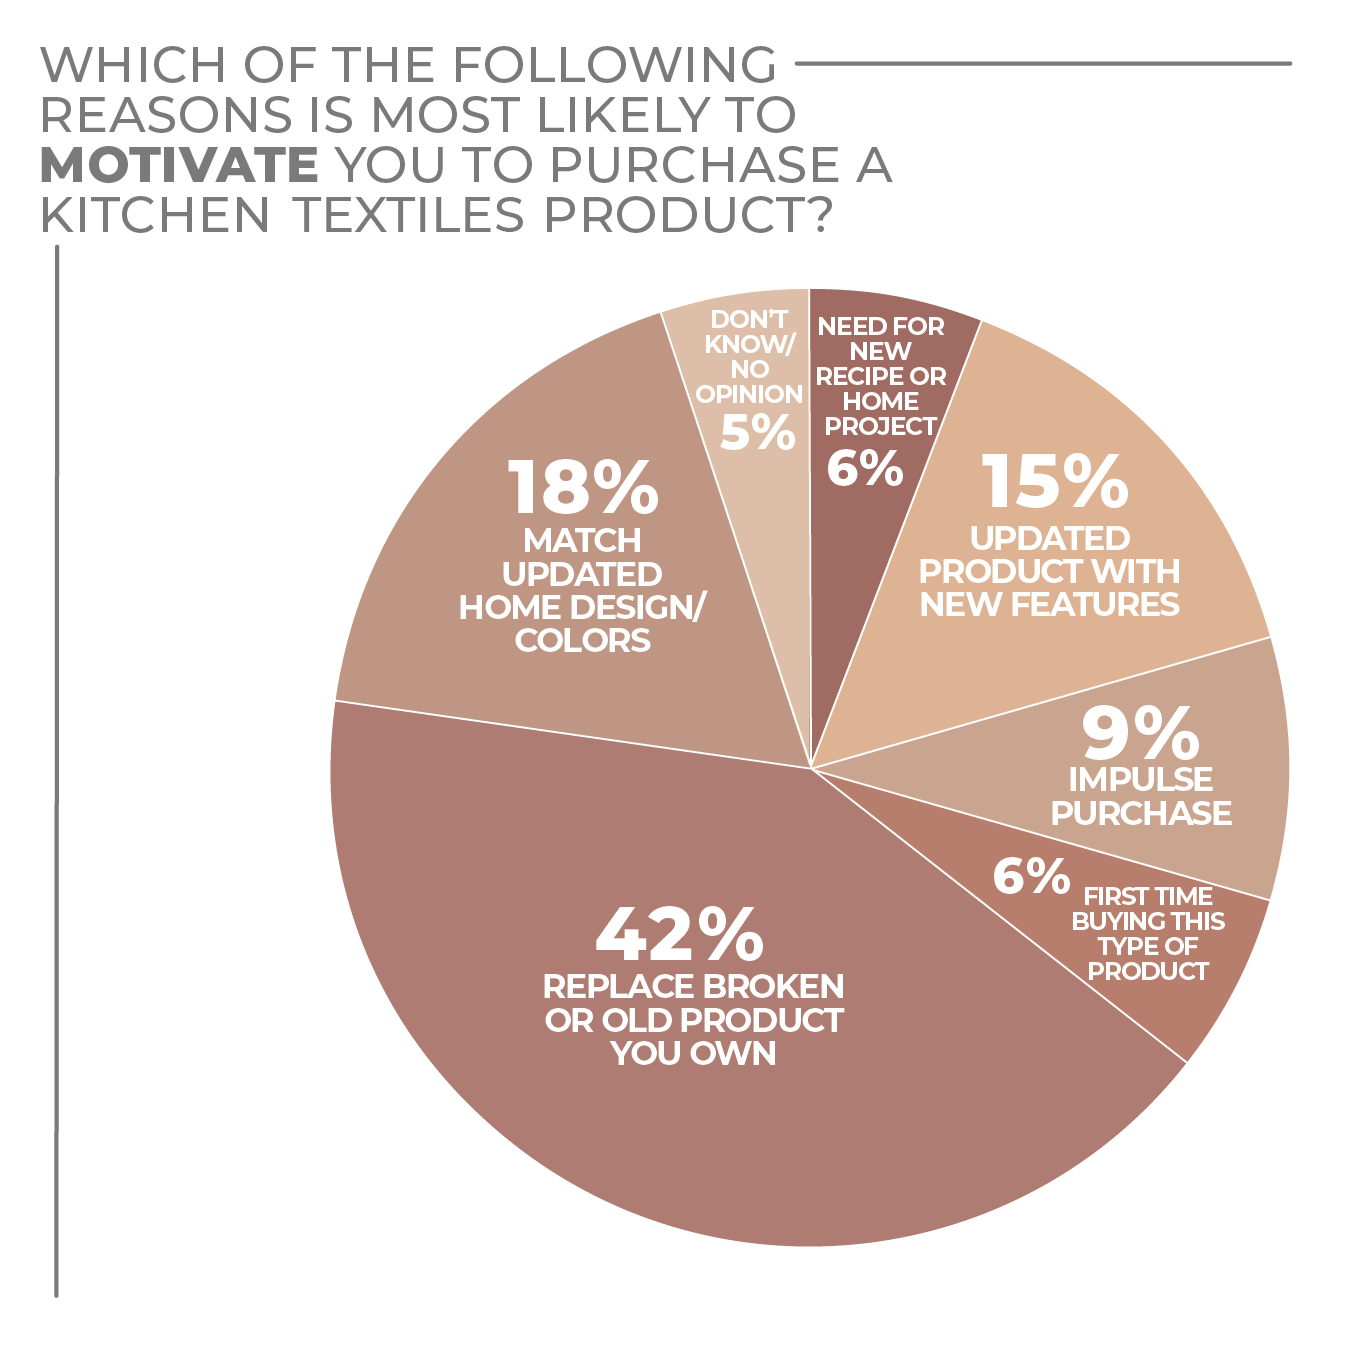
Although largely a replacement category, with 42% of survey respondents indicating they would purchase to replace worn-out kitchen textiles, a third said they would buy in the category based on home projects or product updates, and 9% said they would purchase on impulse.
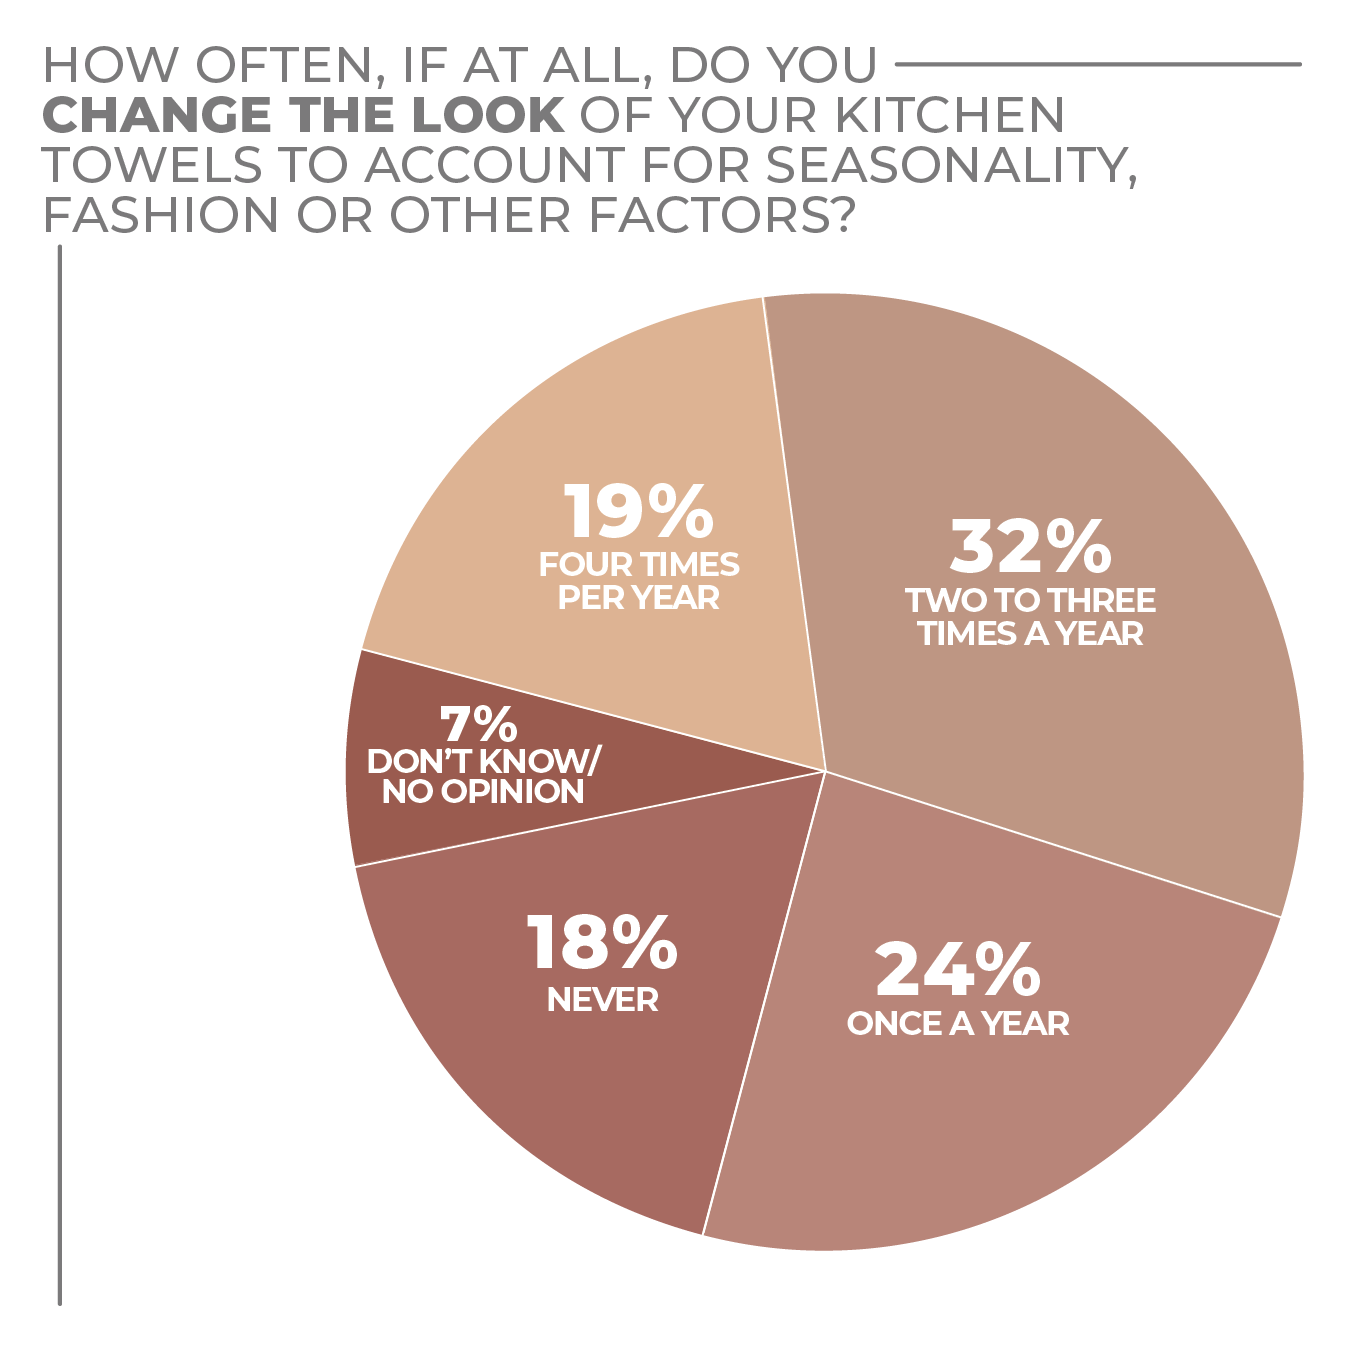
Some 19% of consumers stated that they change their kitchen textiles four times a year, and 32% two or three times annually, again suggesting that consumers are using home textiles in a more than utilitarian manner.
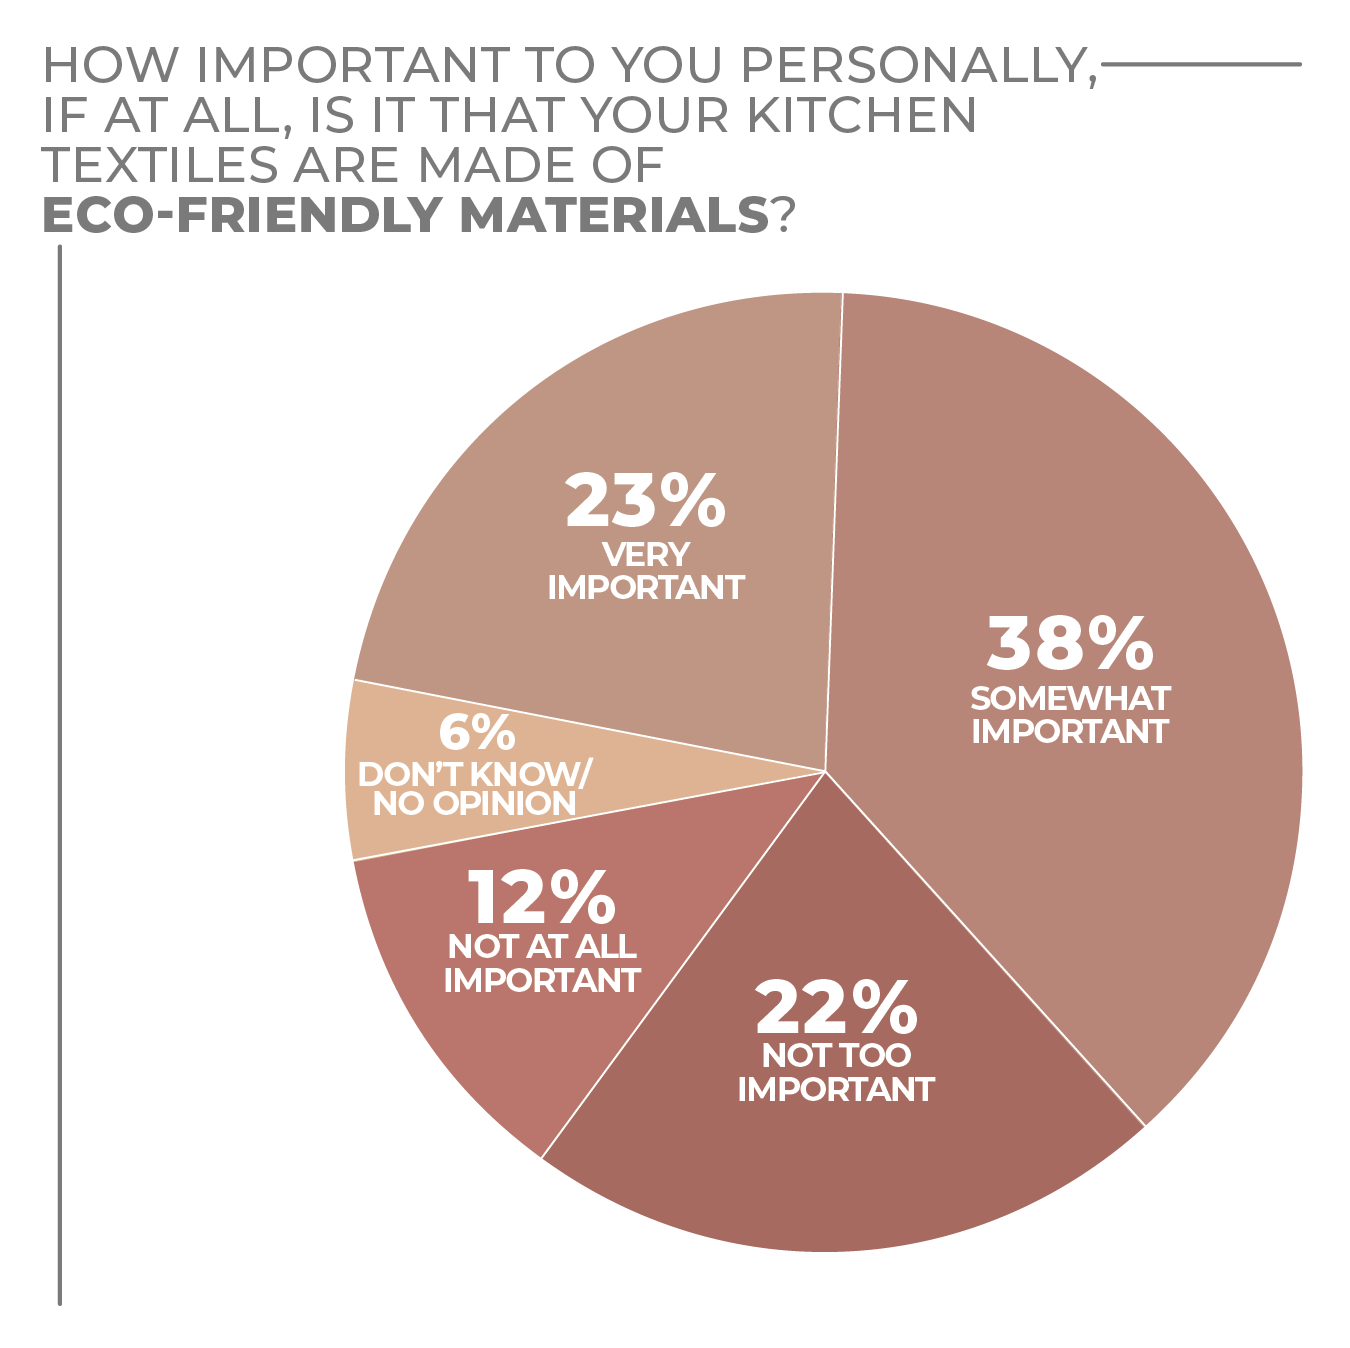
Sustainability may play a bigger role today than it might have in the past. Nearly a quarter of consumers said eco-friendliness is important in their consideration of kitchen textiles, and 38% said it is somewhat important.
Only 12% of consumers in the survey said it was unimportant, which may represent an opportunity for retailers and vendors to reformulate and reposition products.
Although, traditionally, the amount of additional money consumers will spend on a product that has a social benefit attached is limited, giving consumers an option that satisfies the conscience can raise the consumer’s opinion of the provider.
Within the kitchen textiles category, 71% of survey respondents said they were most likely to purchase towels and cloths during the next 12 months, followed by potholders/oven mitts at 43% and cleaning cloths at 40%.
Women are more likely to purchase kitchen textiles during the next year. Although that might not be surprising, what is noteworthy is that the difference between the genders is rather slim, with 28% of women and 22% of men saying they are very likely to purchase kitchen textiles in the next 12 months, while 35% of women and 34% of men said they are somewhat likely to do so.
Millennials, in their prime years of household creation, are most ready to buy kitchen textiles by generation with 32% very likely and 35% somewhat likely to purchase such products, followed by Gen Xers at 27% very likely and 36% somewhat likely to buy kitchen textiles.
More Kitchen Textiles Findings:
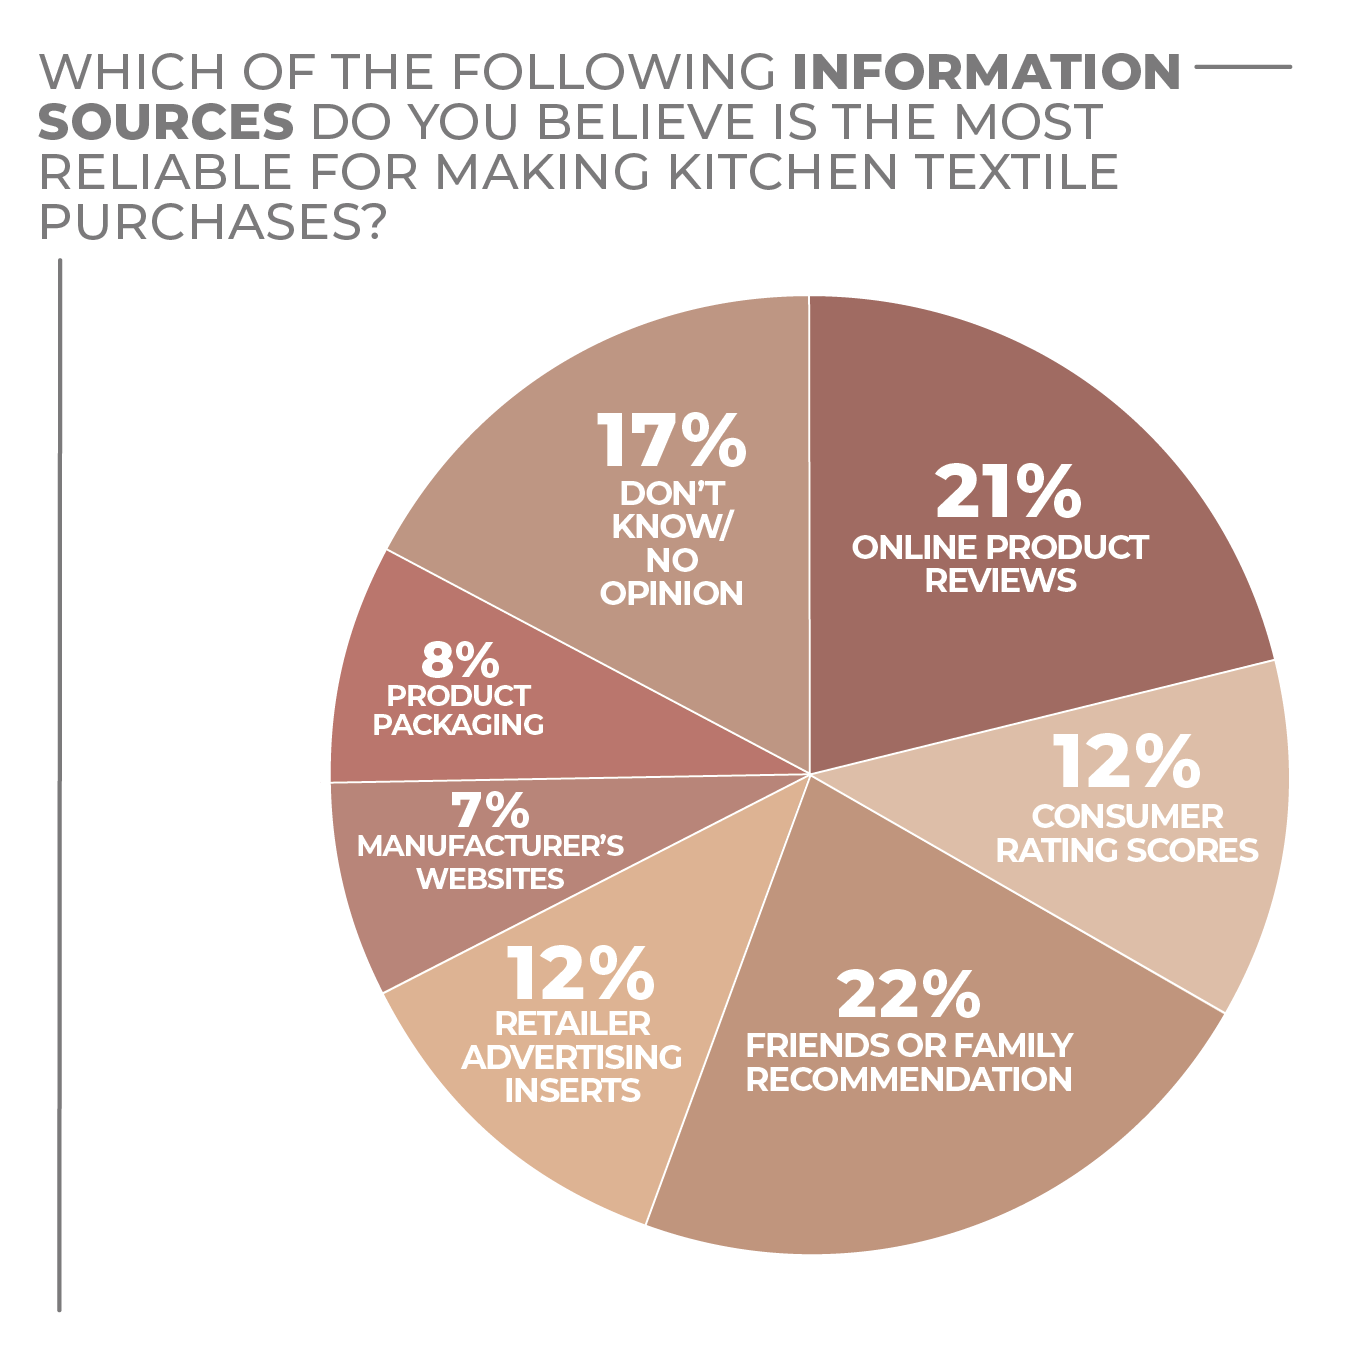
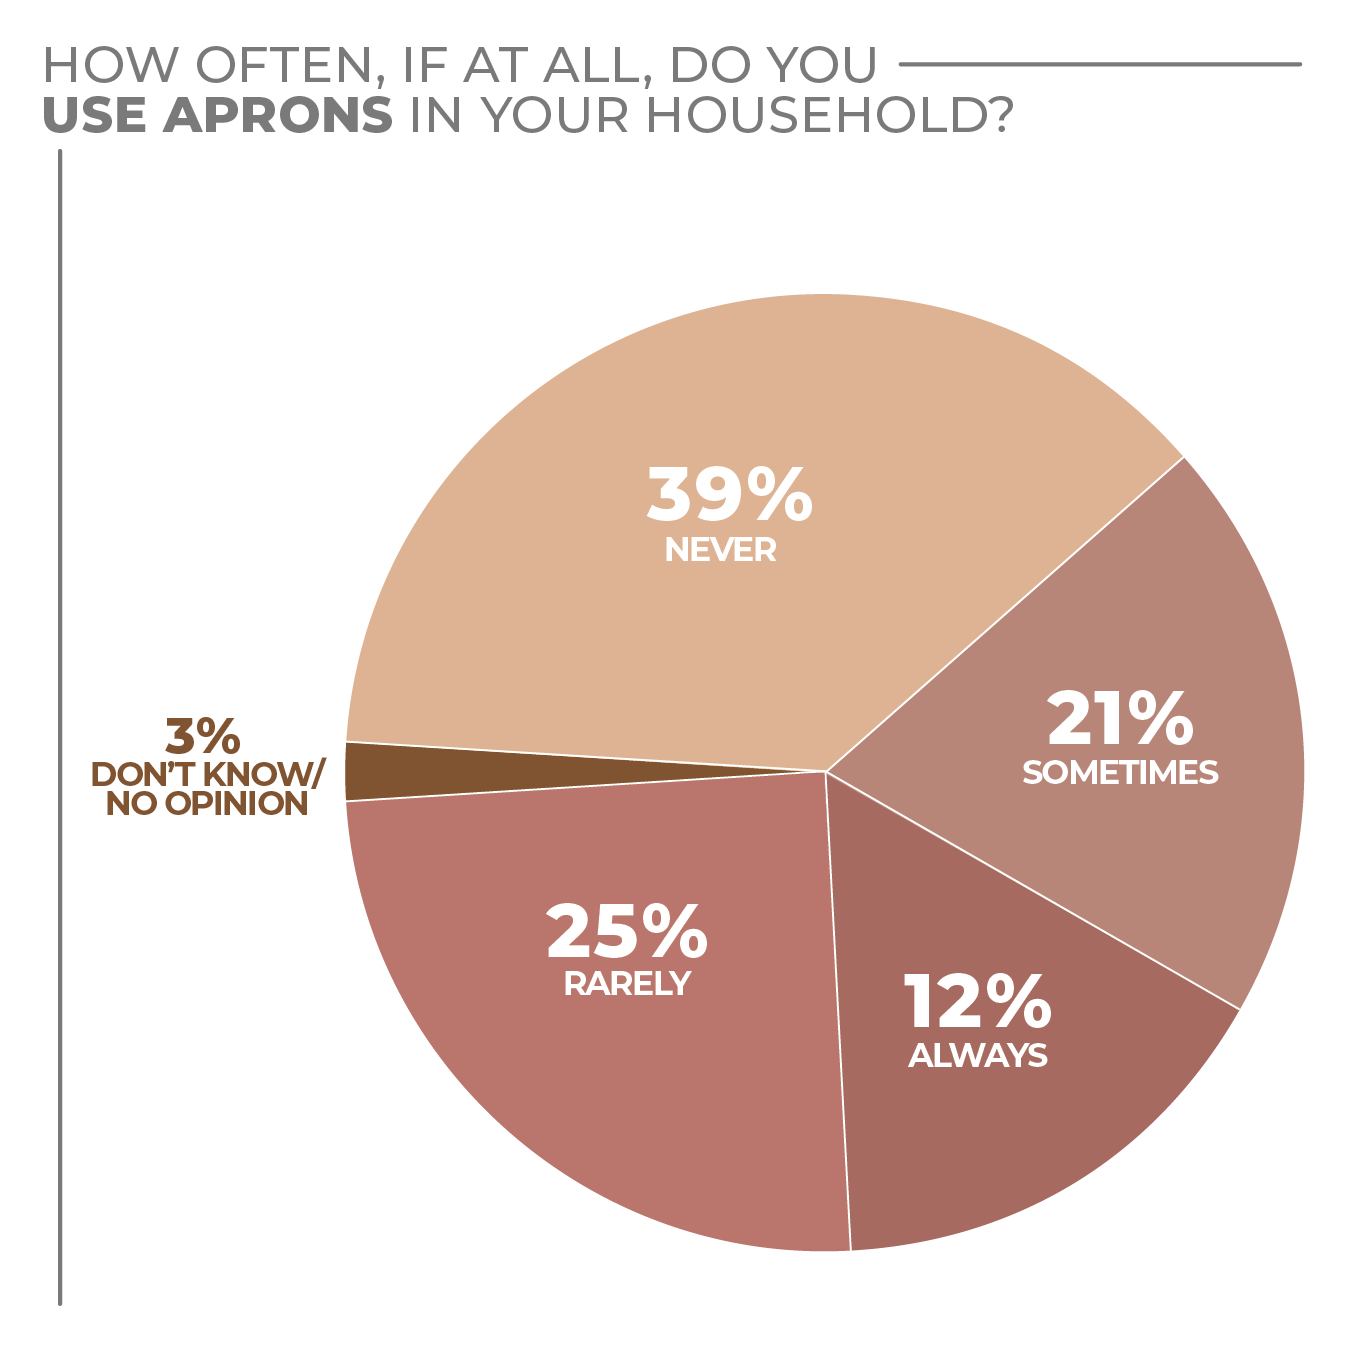
Click on charts to enlarge.
Kitchen Tools & Gadgets
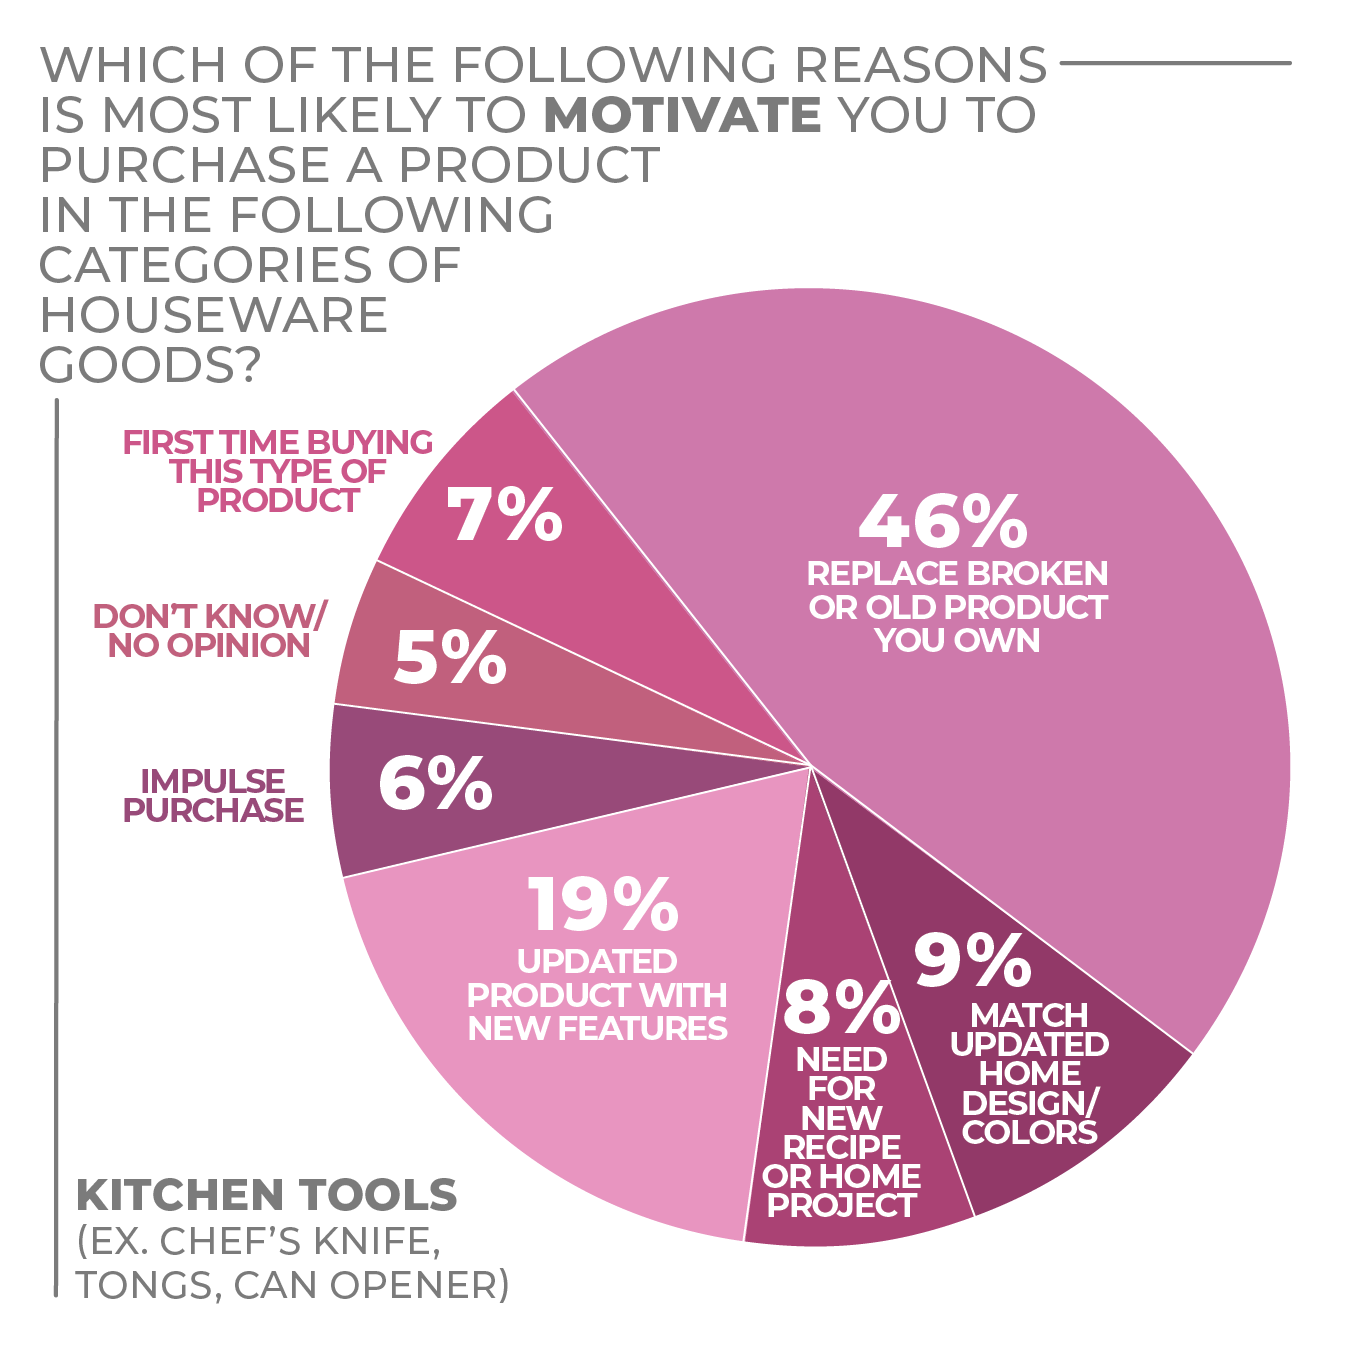
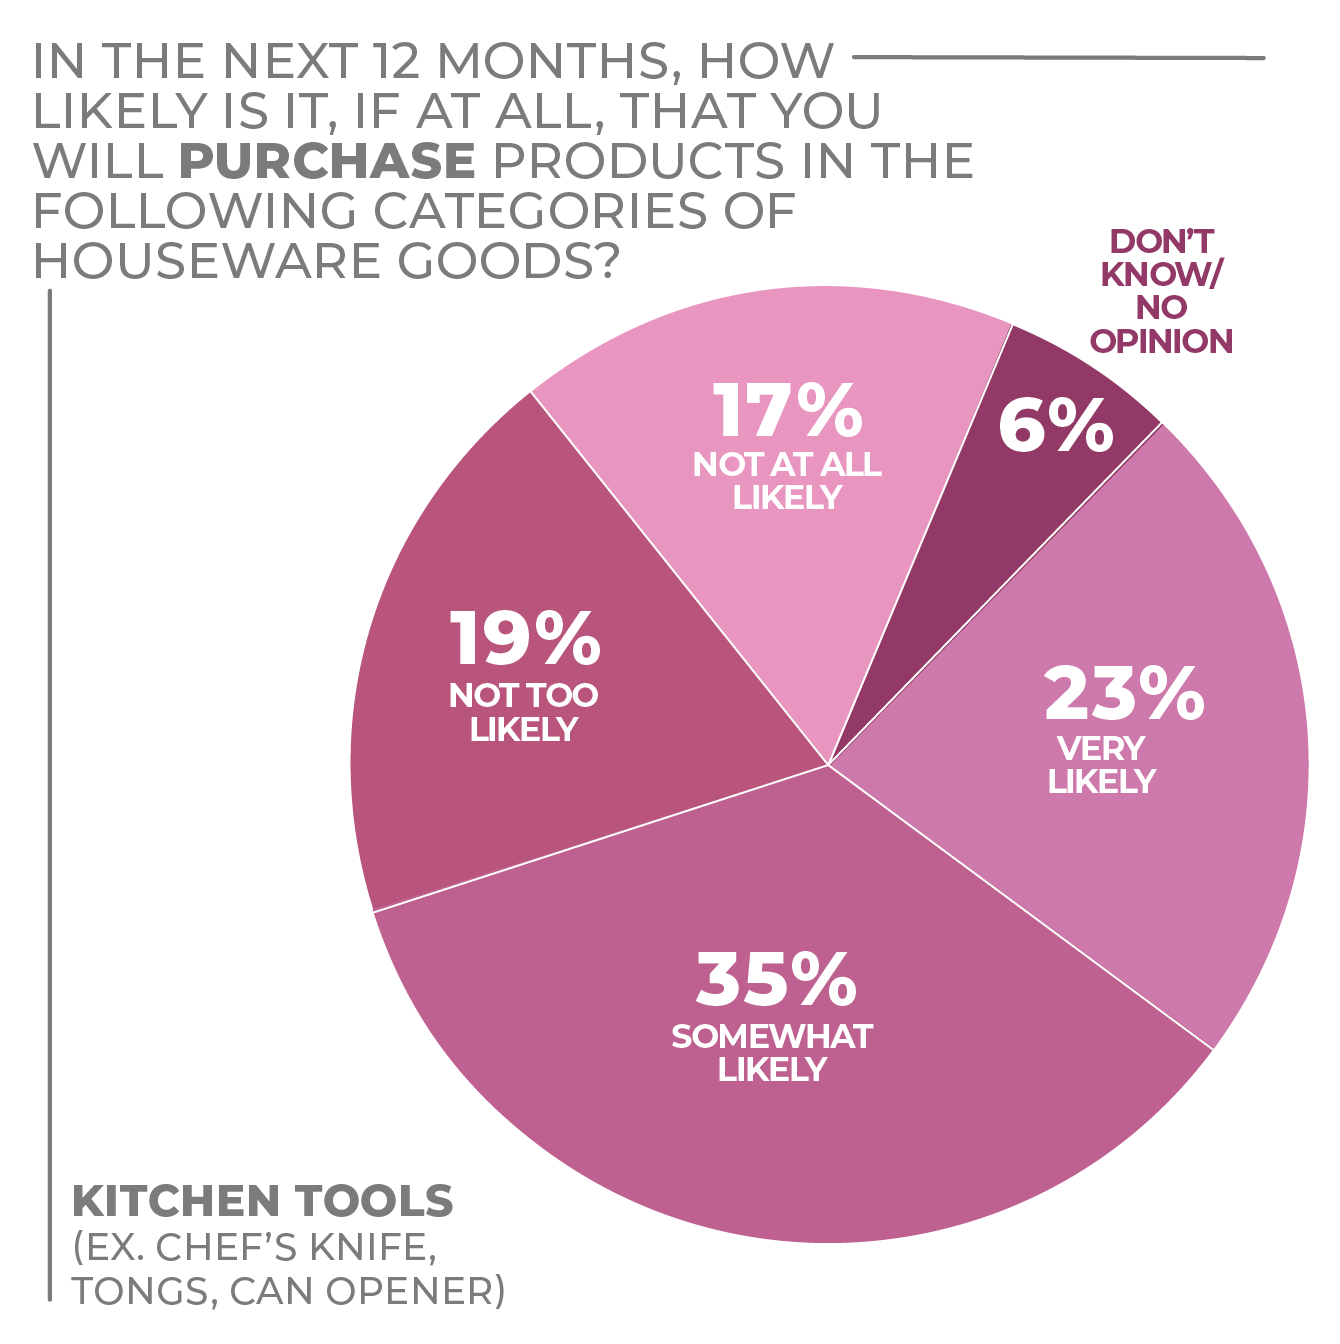
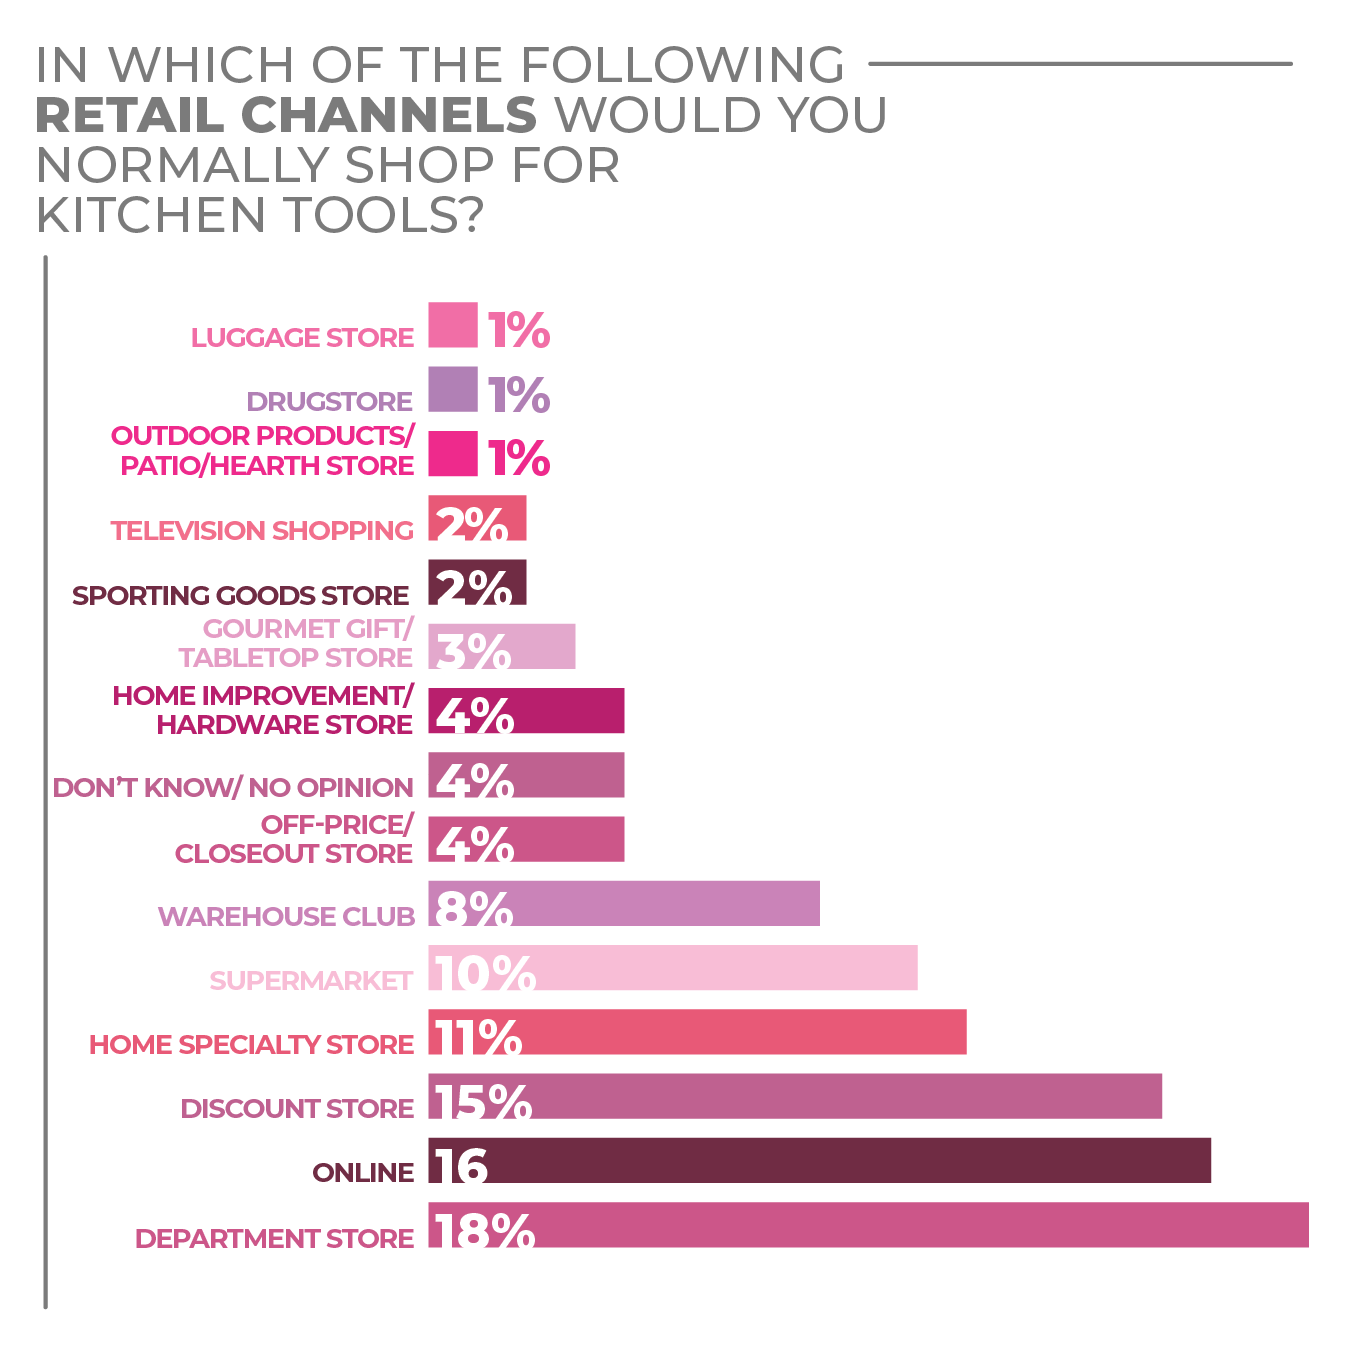
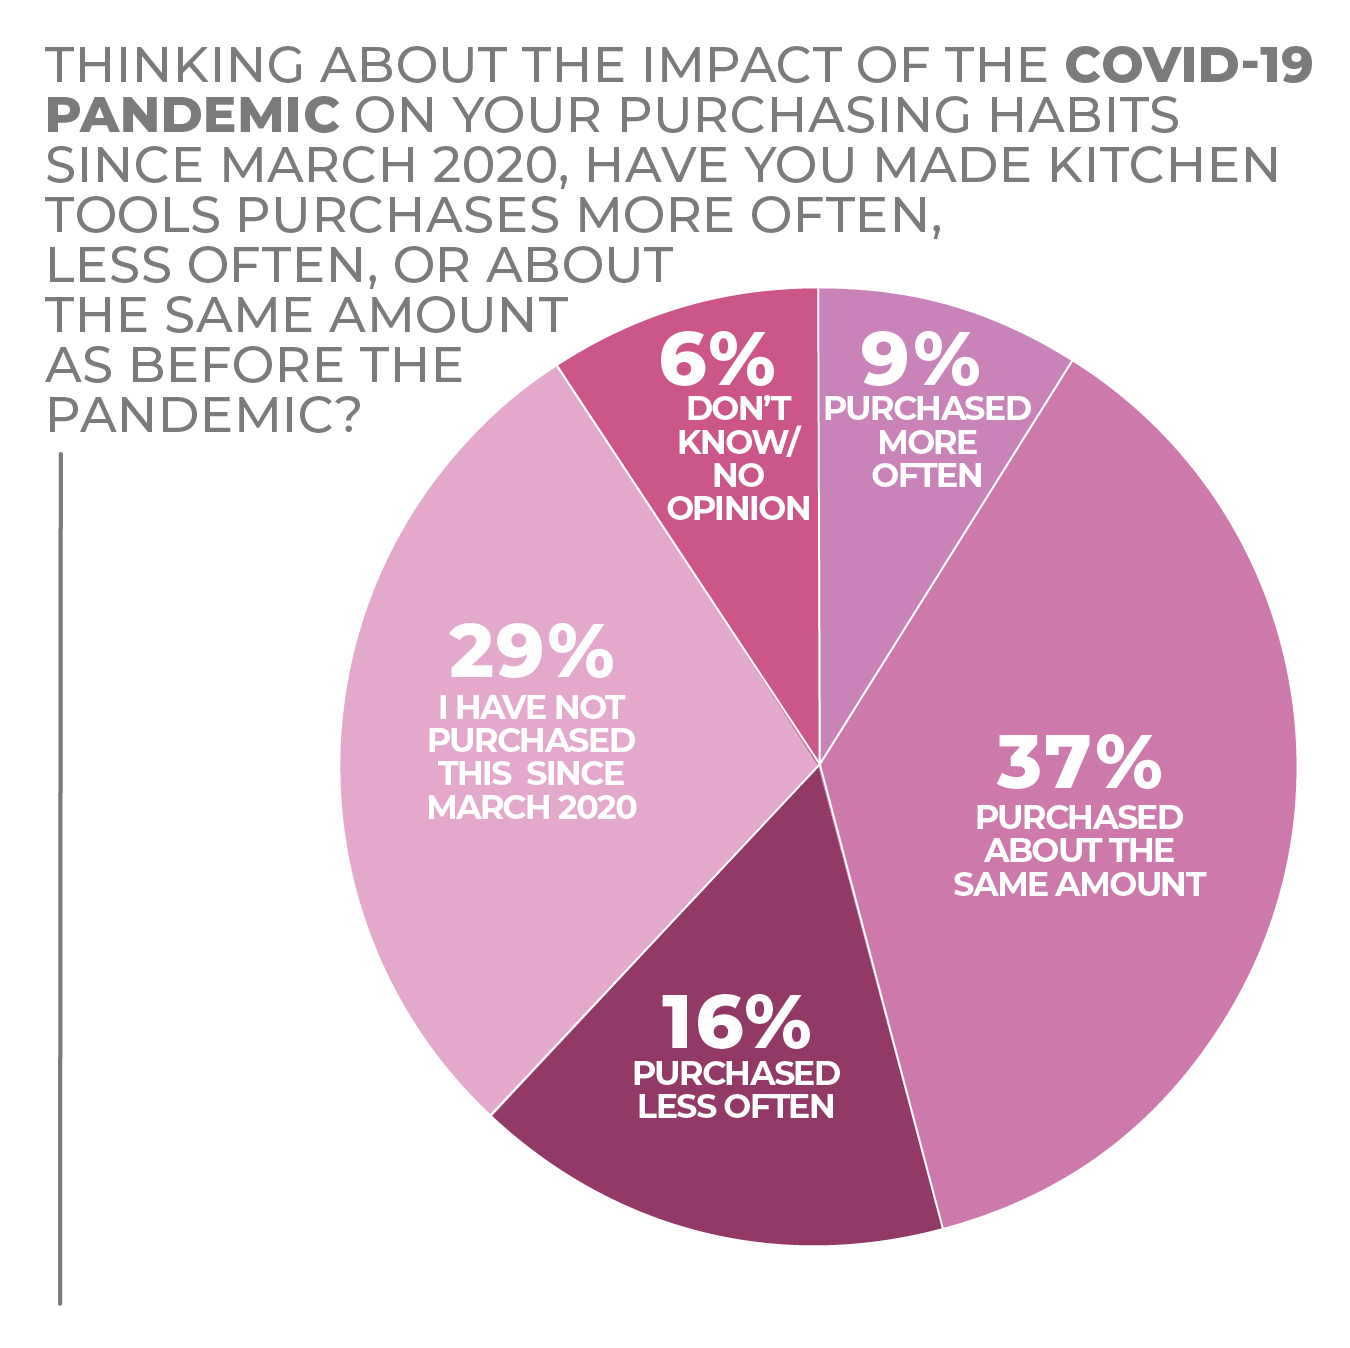
Fueled by the desire to try new recipes and test new cooking techniques, consumers have been adding kitchen tools and gadgets to their arsenal at a steady pace.
With a focus on convenience to tackle fresh ingredients quickly and efficiently, the industry has been focused on single-use tools that get the job done. Graters and peelers have seen a resurgence in order to tackle peeling or grating different types of vegetables for slaws and salads such as beets, asparagus and yucca.
Meanwhile, baking accessories have also seen an uptick as consumers are looking for cookie dough scoops and batter dispensers that give them precise results. Food scales have also seen growth in interest because of a focus on healthier portions and perfecting recipes. Meanwhile, growing interest in spices is driving purchase intent for a variety of tools designed specifically for grating or milling cinnamon, nutmeg, garlic, ginger and turmeric.
And while new ideas are a hot commodity, so too are classic tools and gadgets with modern updates.
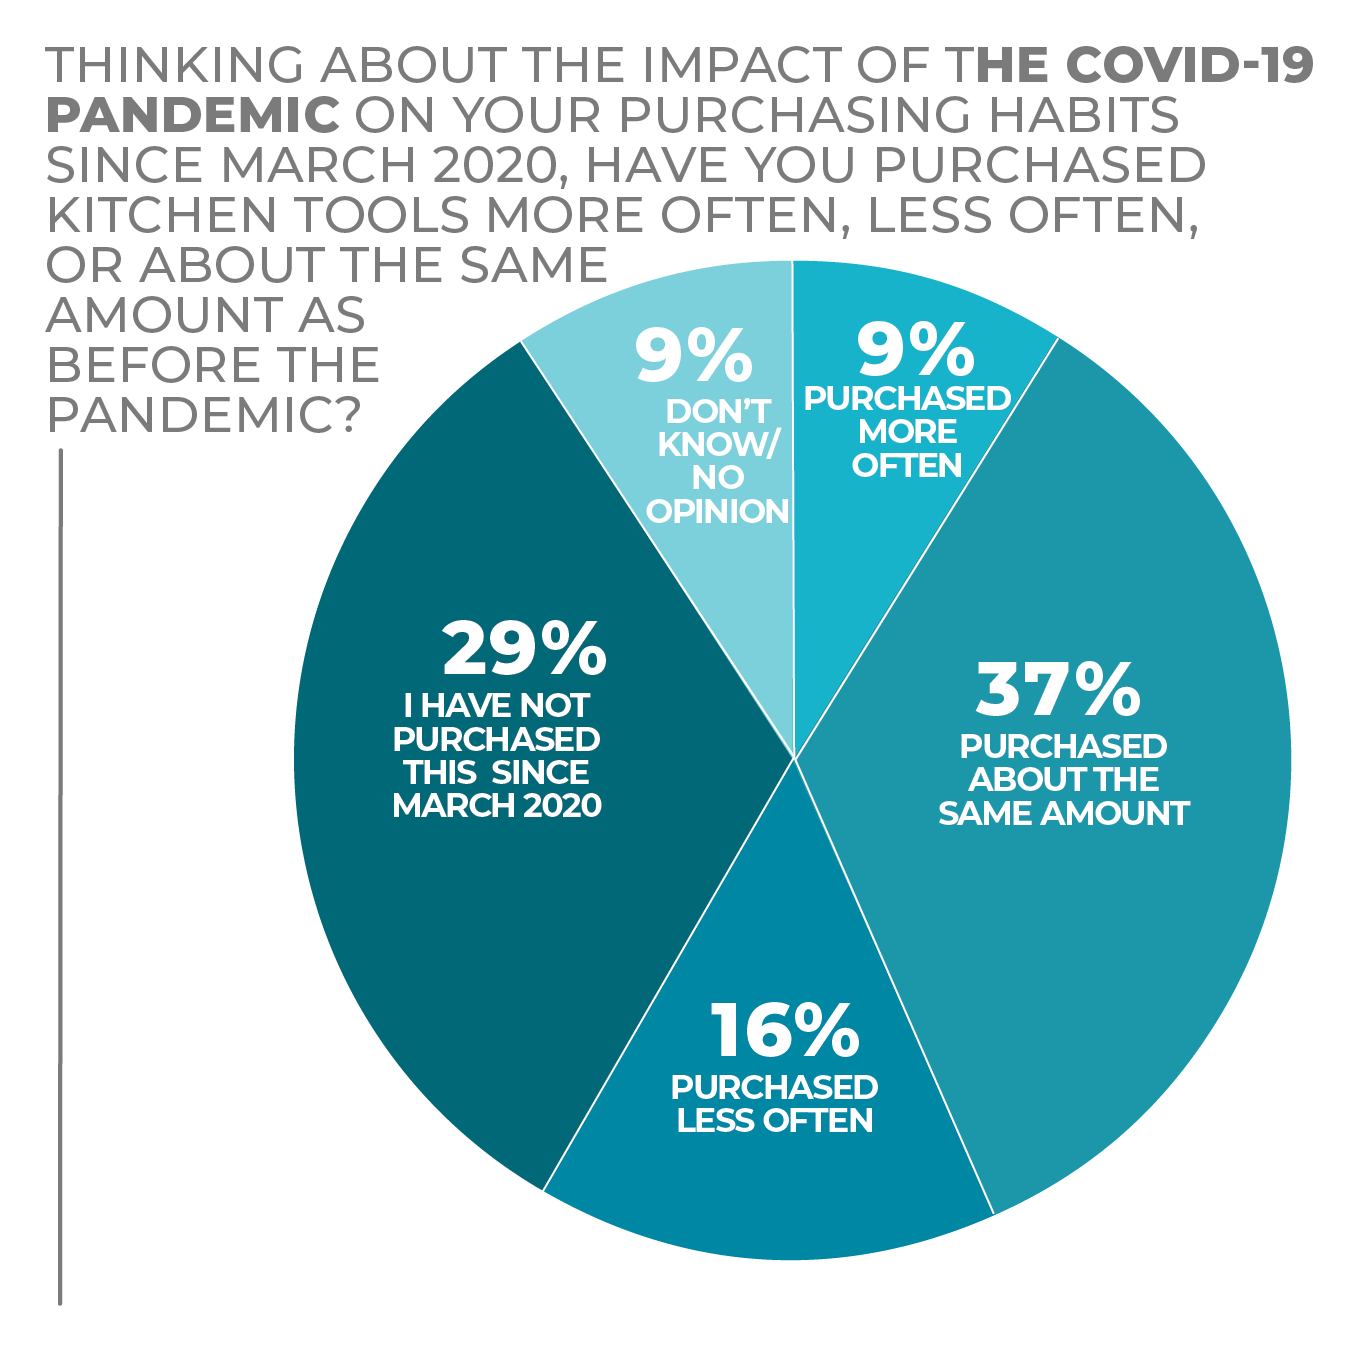
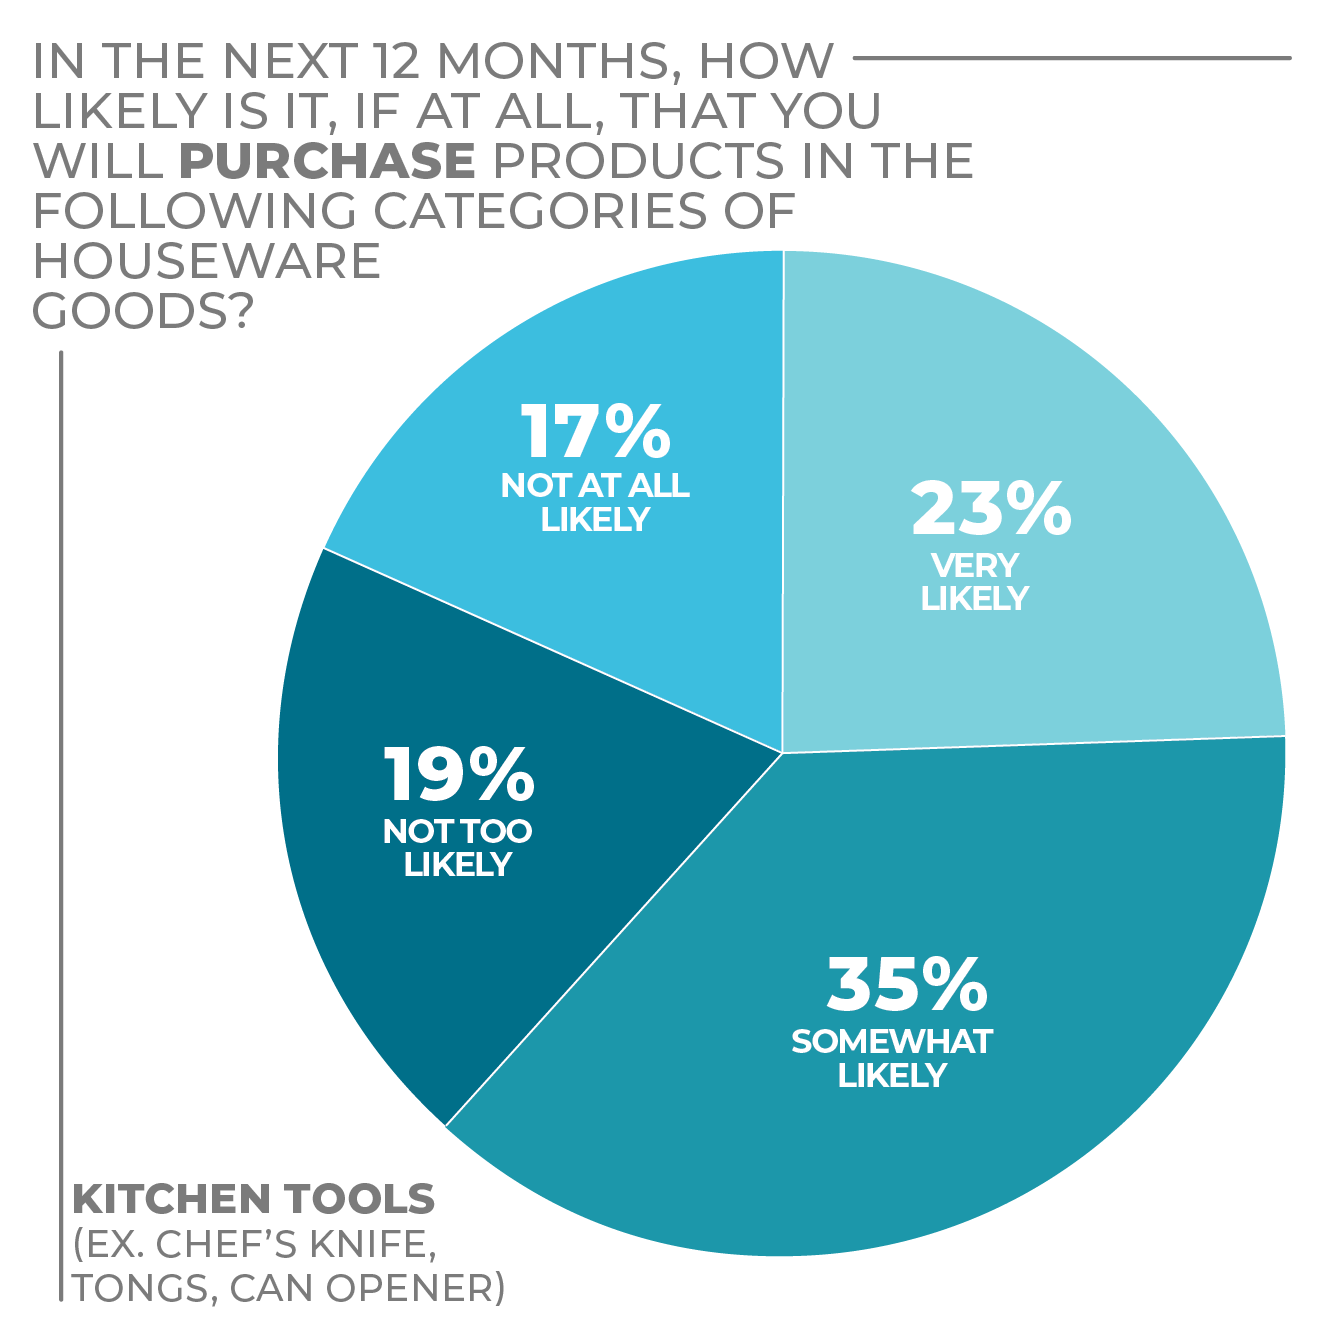
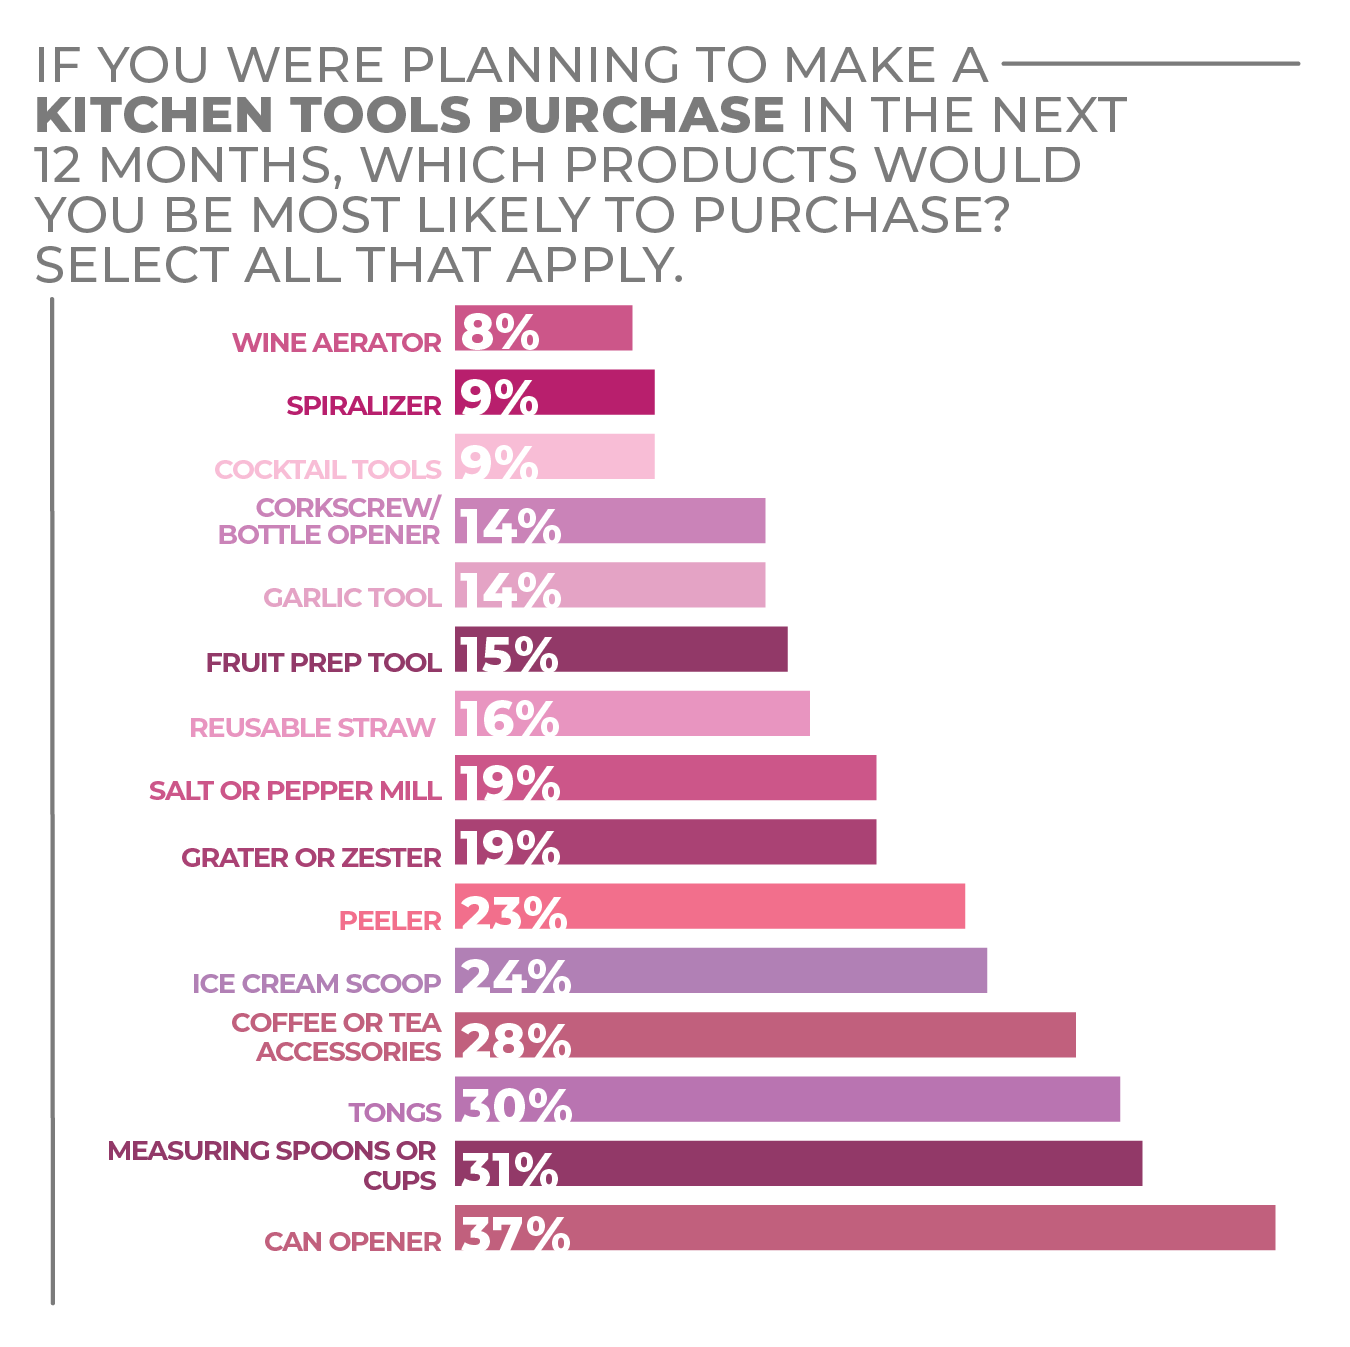
Consumers reported that they were most interested in purchasing a new can opener (selected by 37% of respondents), measuring cups and spoons (31%), tongs (30%) and coffee or tea accessories (28%).
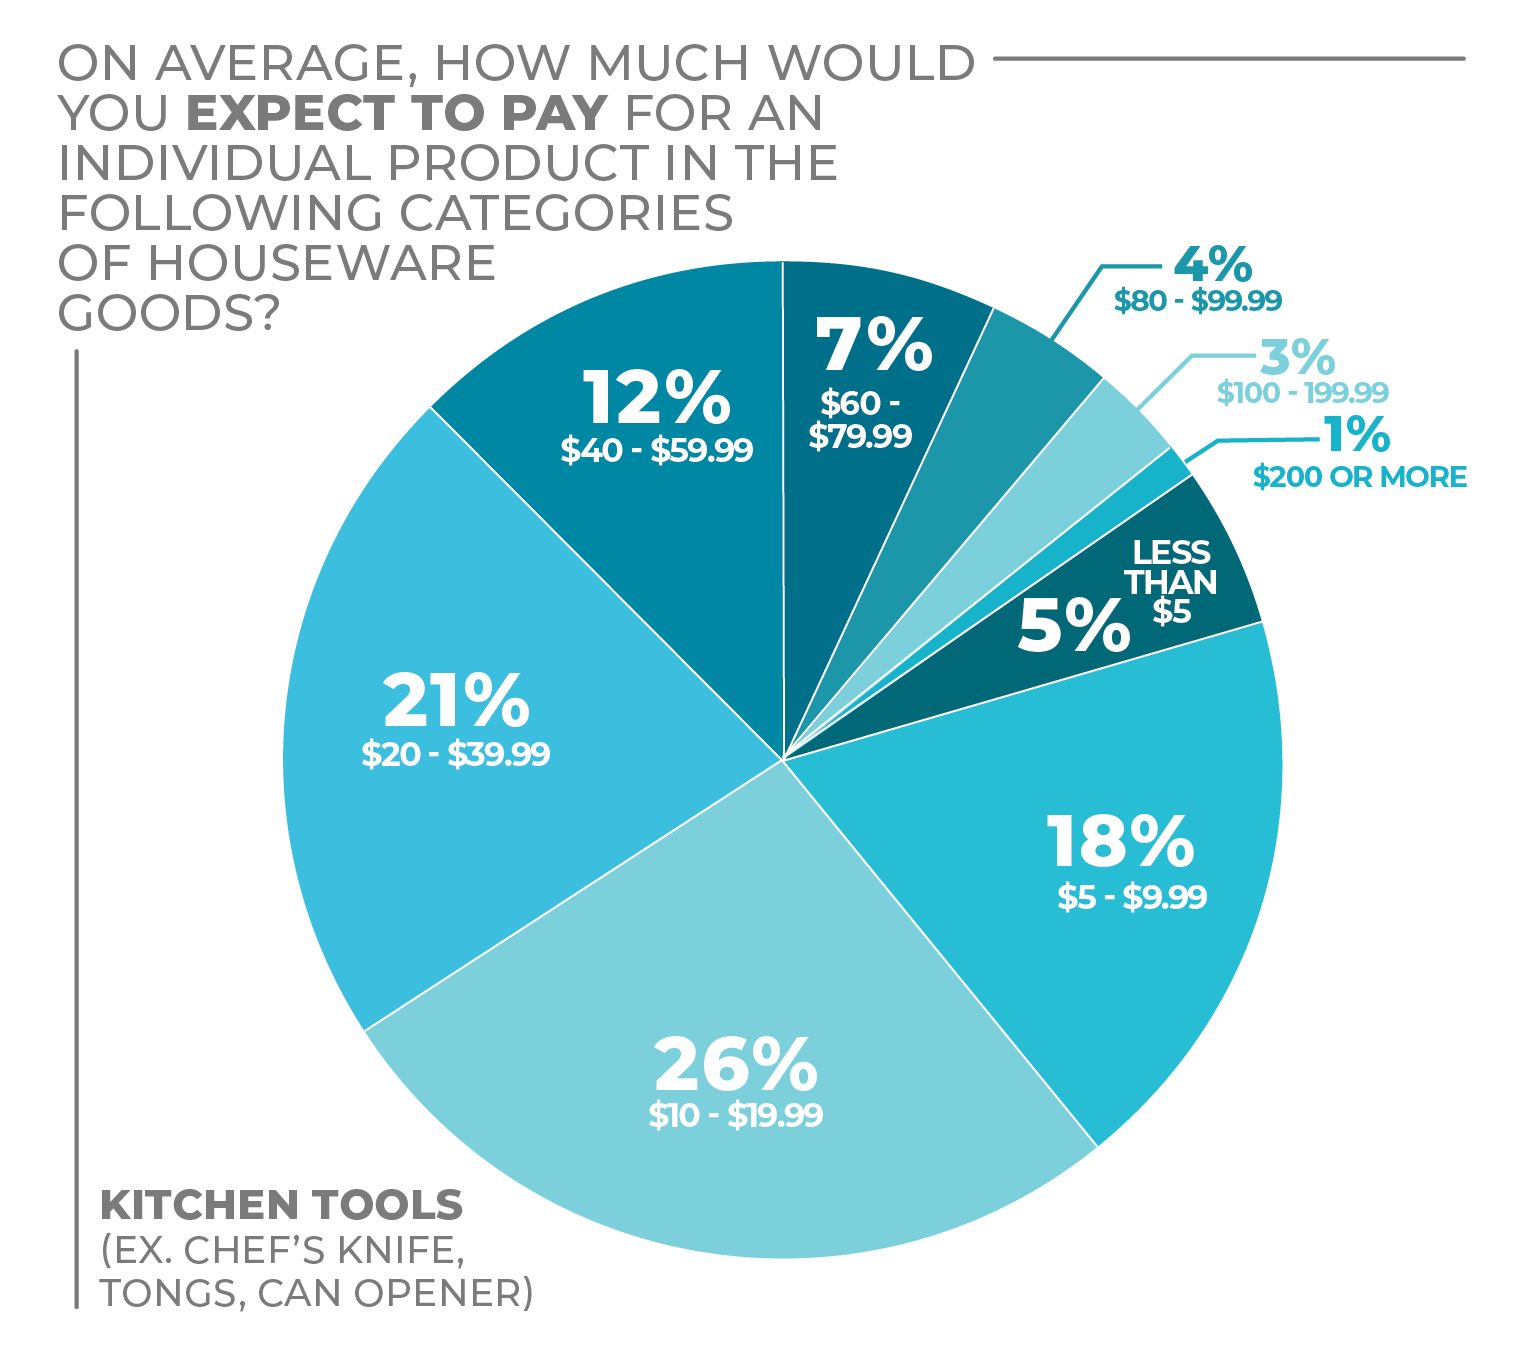
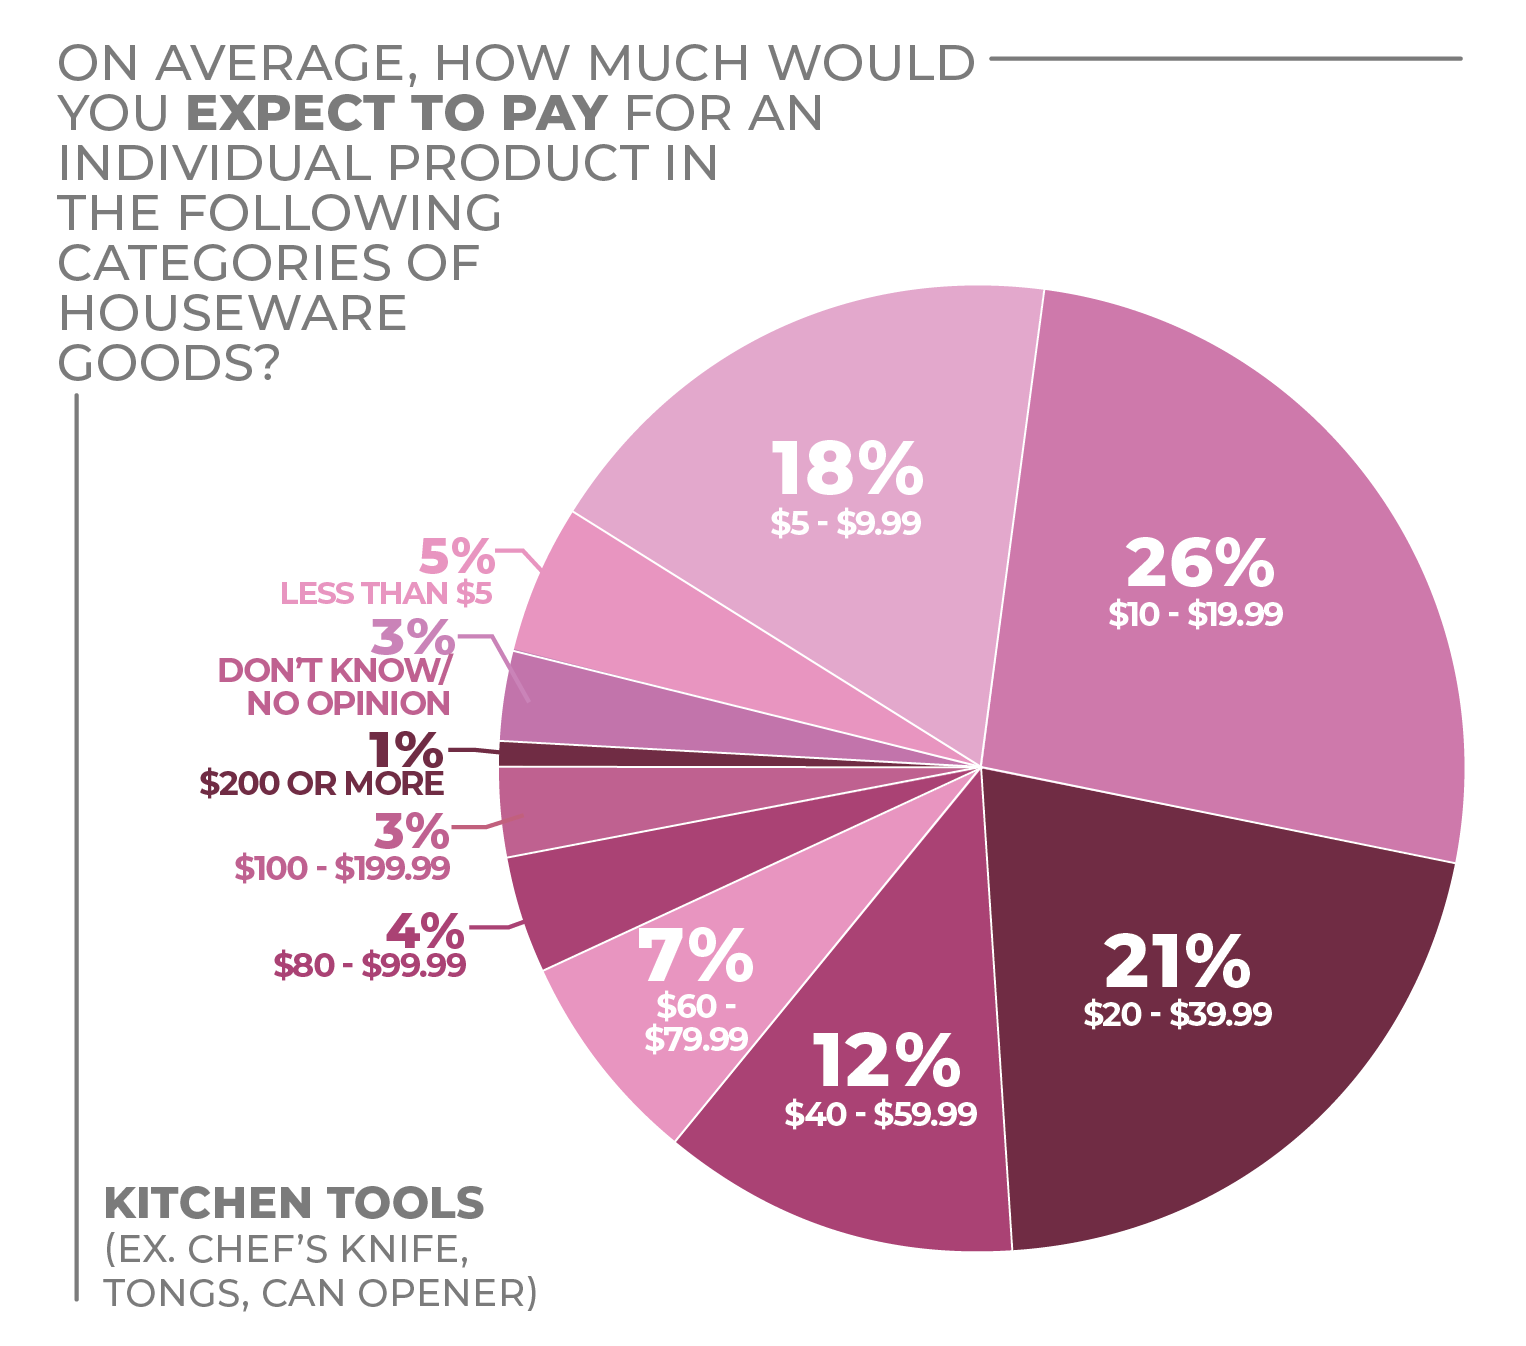
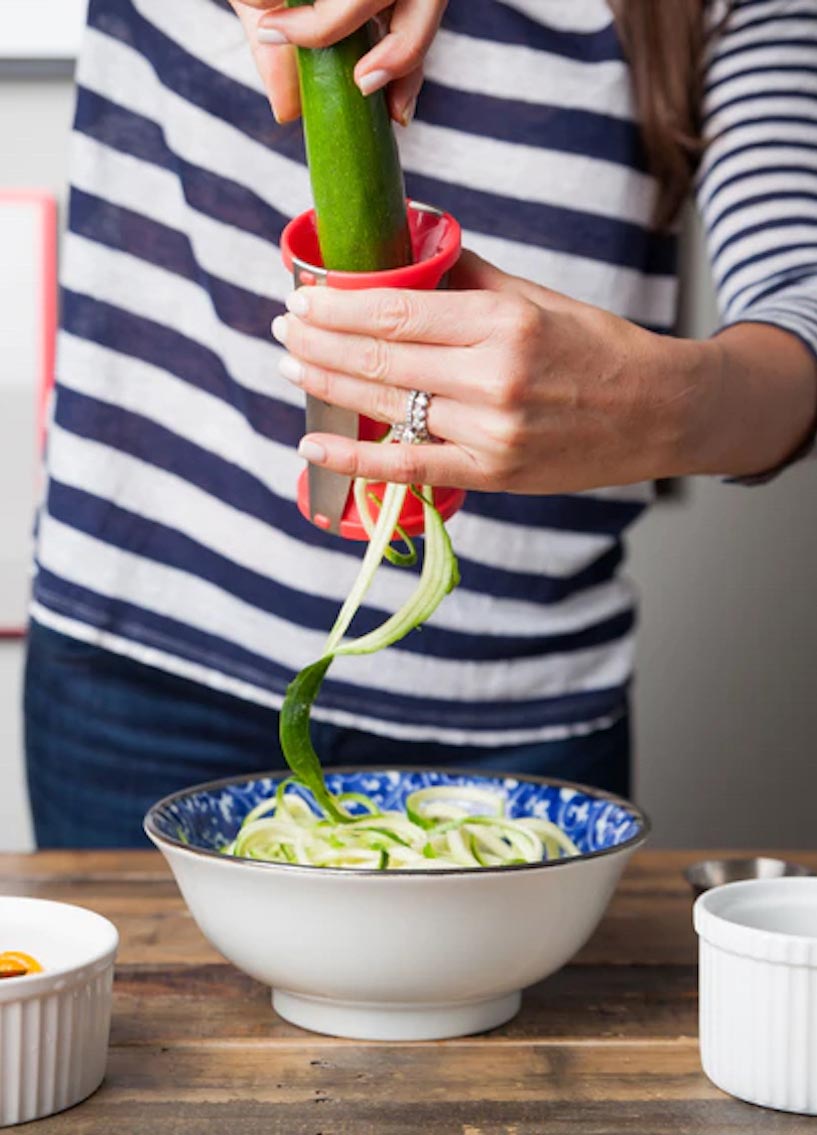
As for price expectations, the sweet spot falls within $5 to $39.99 with the majority (65%) selecting this as their preferred price range. Consumers indicate they are willing to accept higher prices on such kitchen tools as a wine opener, aerator, spiralizer or manual food chopper that satisfy their needs.
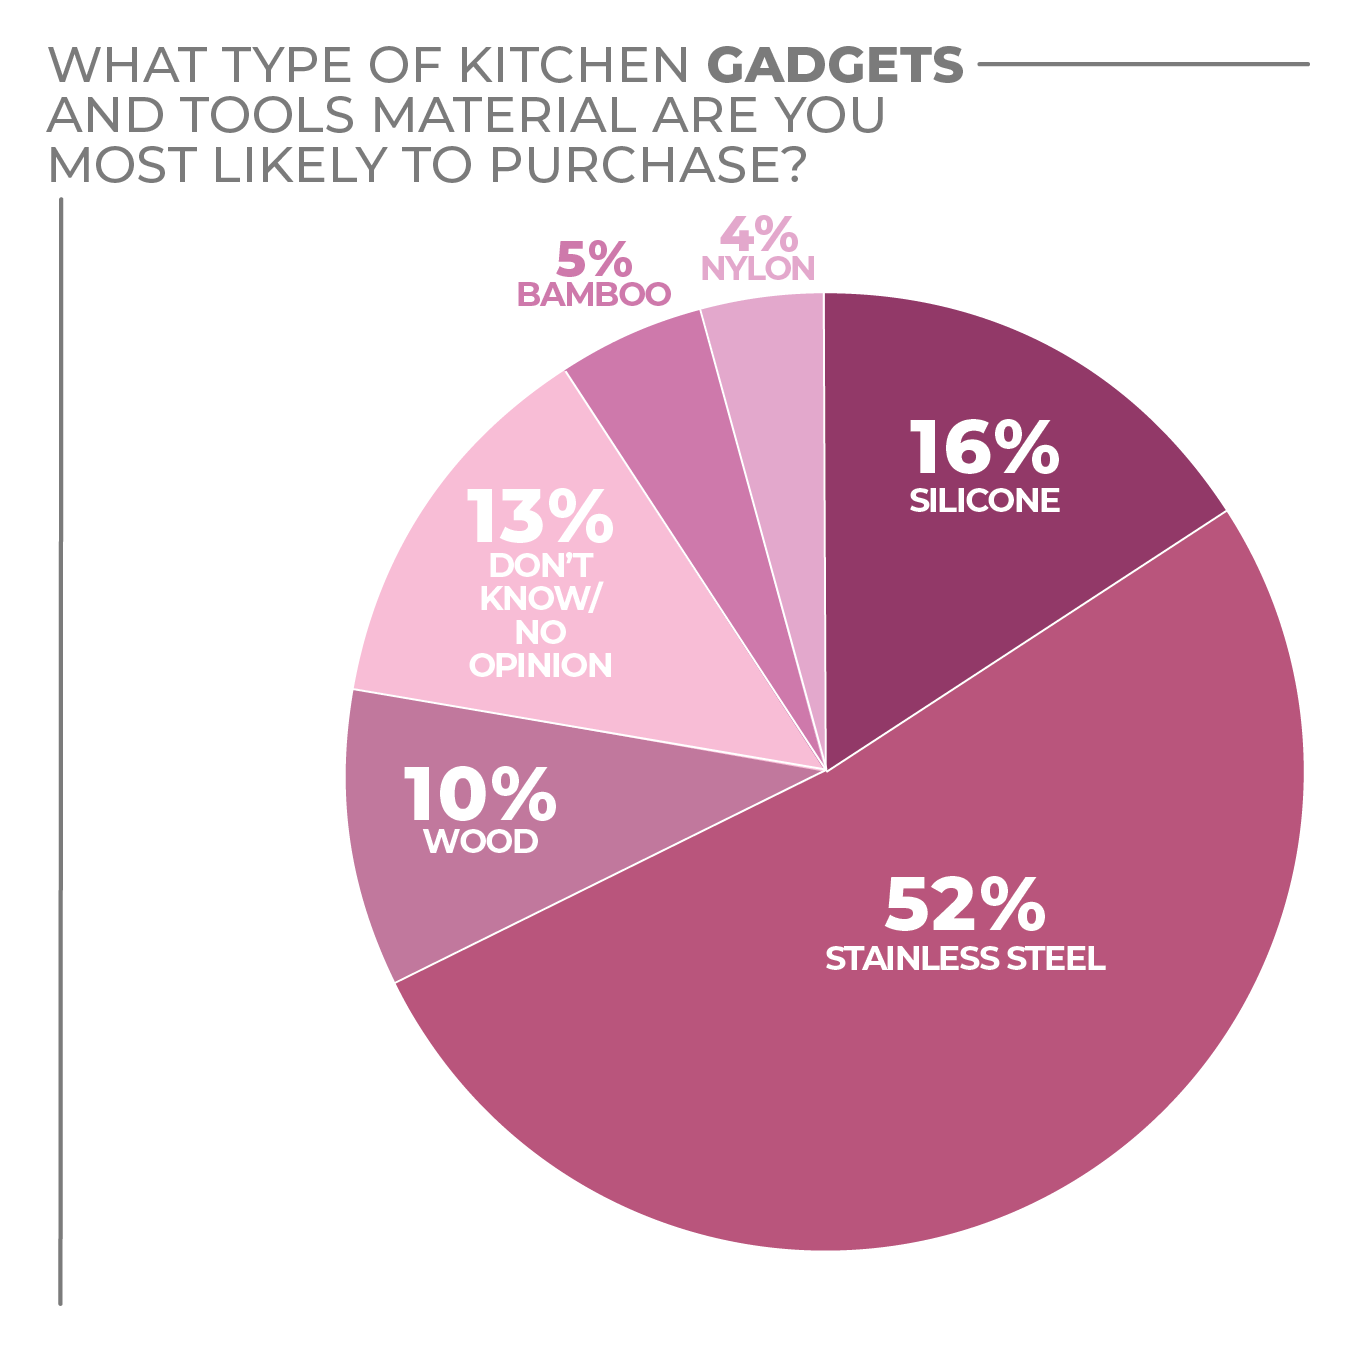
Consumers still gravitate mostly to stainless steel (52%) tools versus silicone (16%).
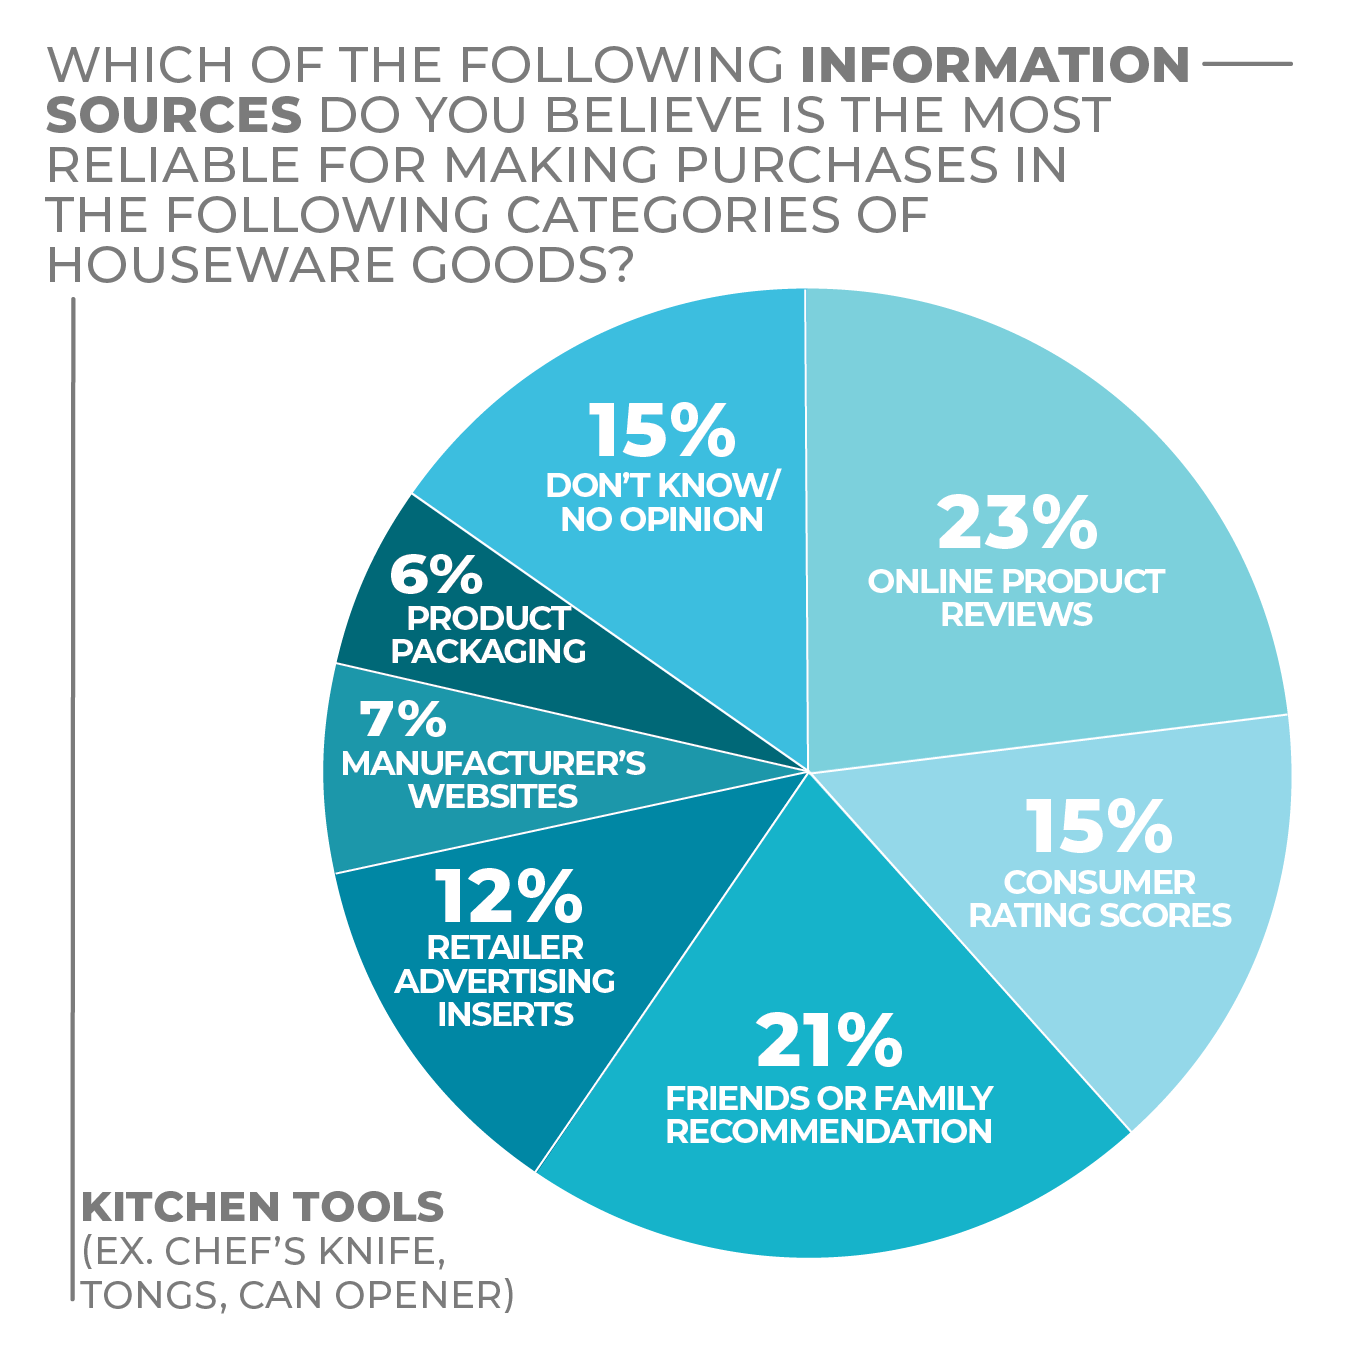
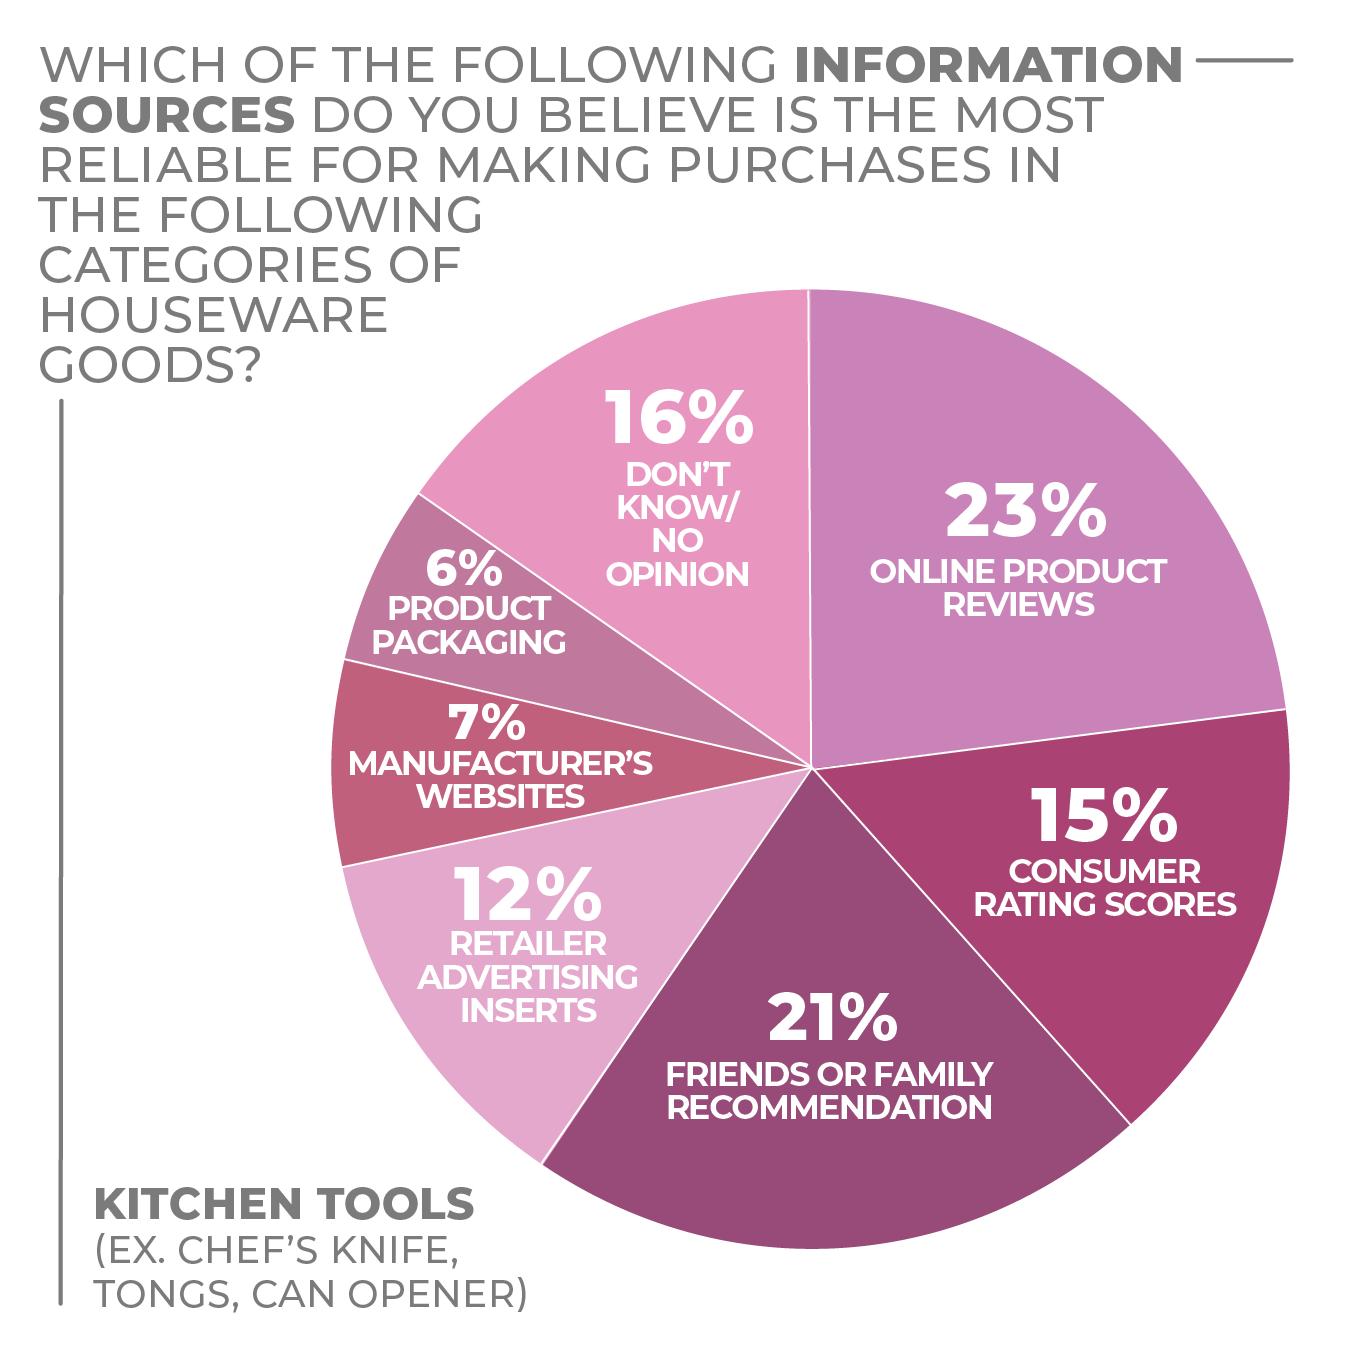
As with the majority of categories, consumers said they rely most on online product reviews (23%) and family or friend recommendations when making purchase decisions.
More Kitchen Tools & Gadgets Findings:
Click on charts to enlarge.
Personal Care & Wellness
That many people haven’t been going out as much during the COVID-19 pandemic doesn’t mean that personal care is any less important. And, if anything, wellness has become a bigger consideration.
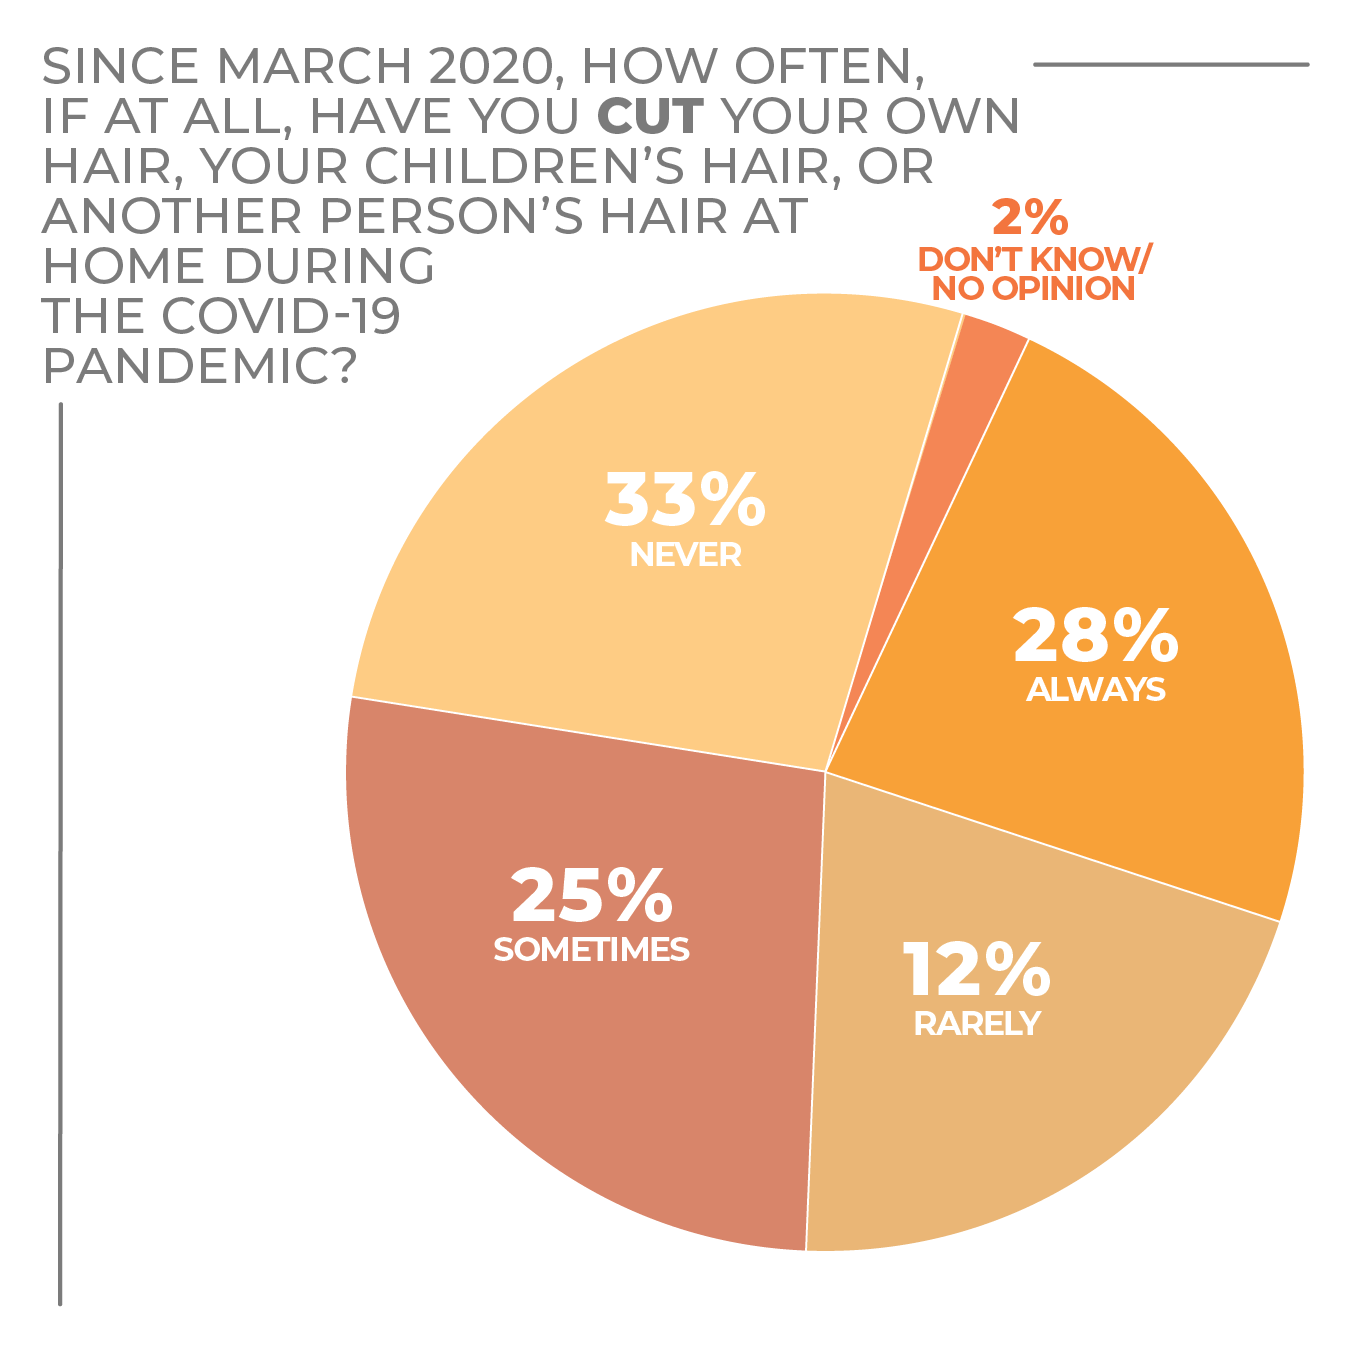
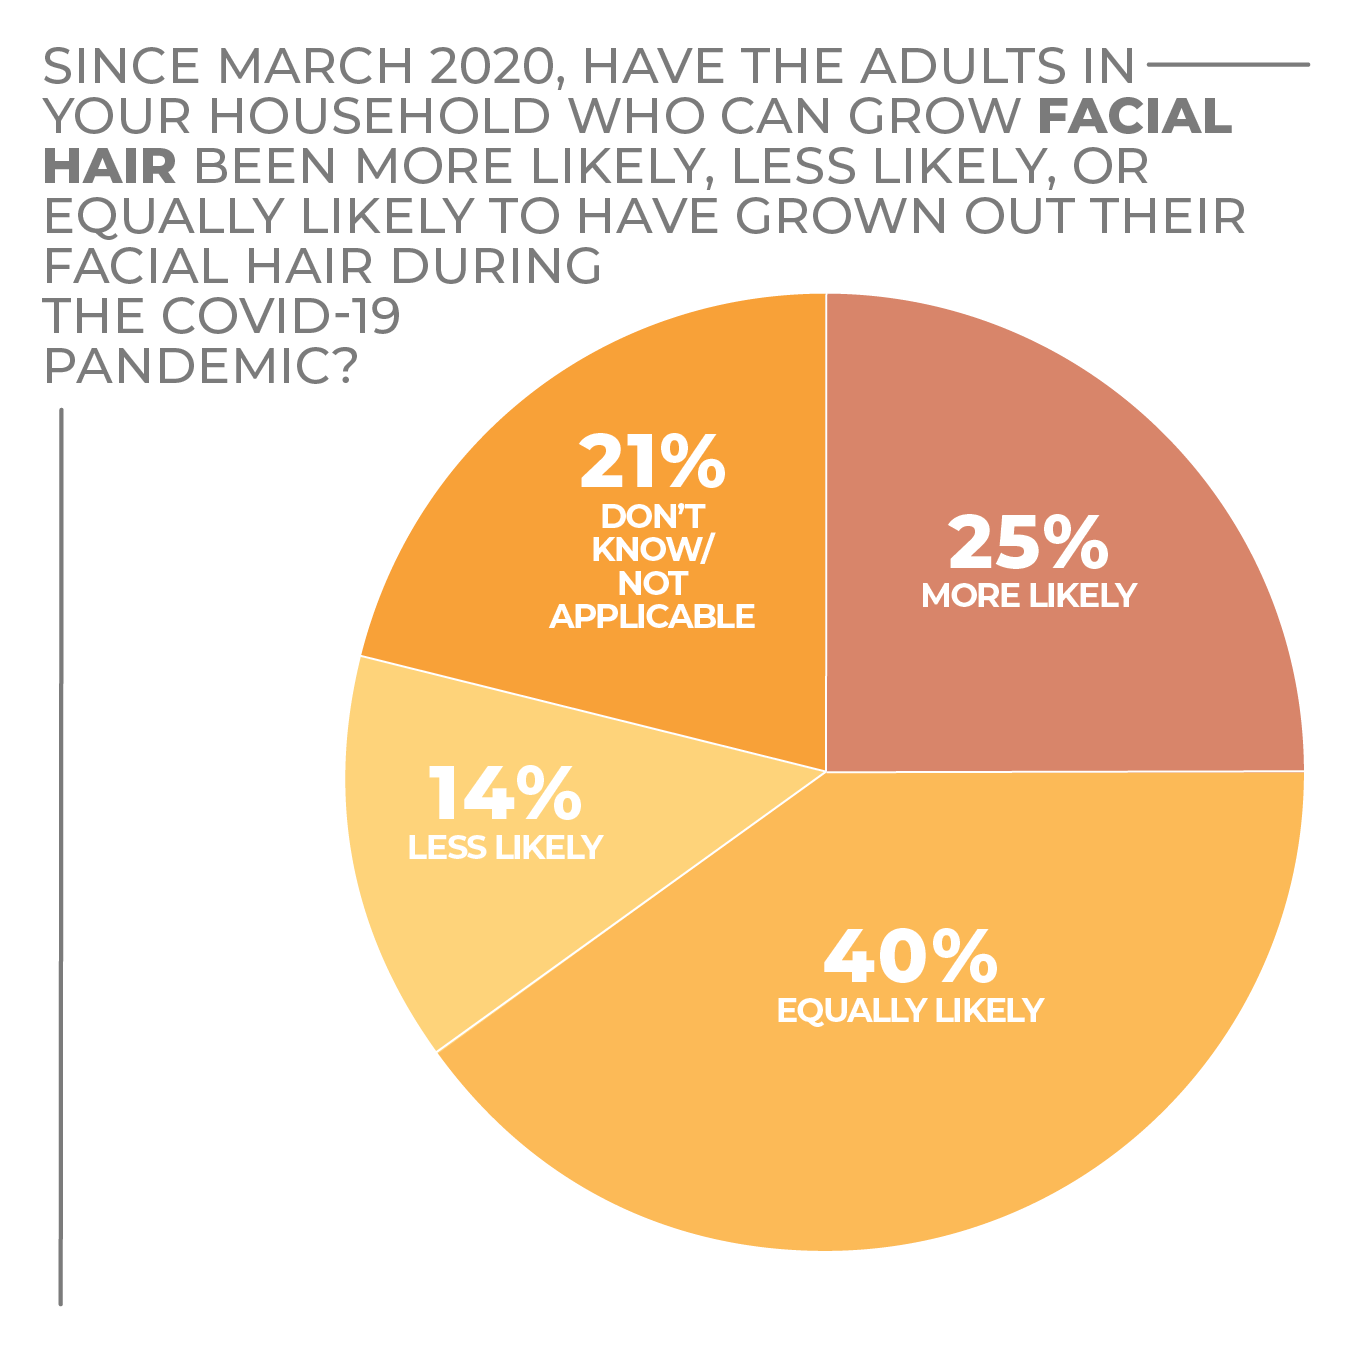
As the pandemic continued, jokes flew fast and furious about declining concerns with appearances. Beards got longer and salon appointments became non-existent. While consumers haven’t forsaken personal appearance by any means, they’ve become more concerned about wellness in terms of their physical and mental health. In some cases, they’re dealing directly with issues that come with spending too much time at home, such as the effects of overeating and how to give kids a proper haircut if they aren’t comfortable taking them to barbers and hair stylists.
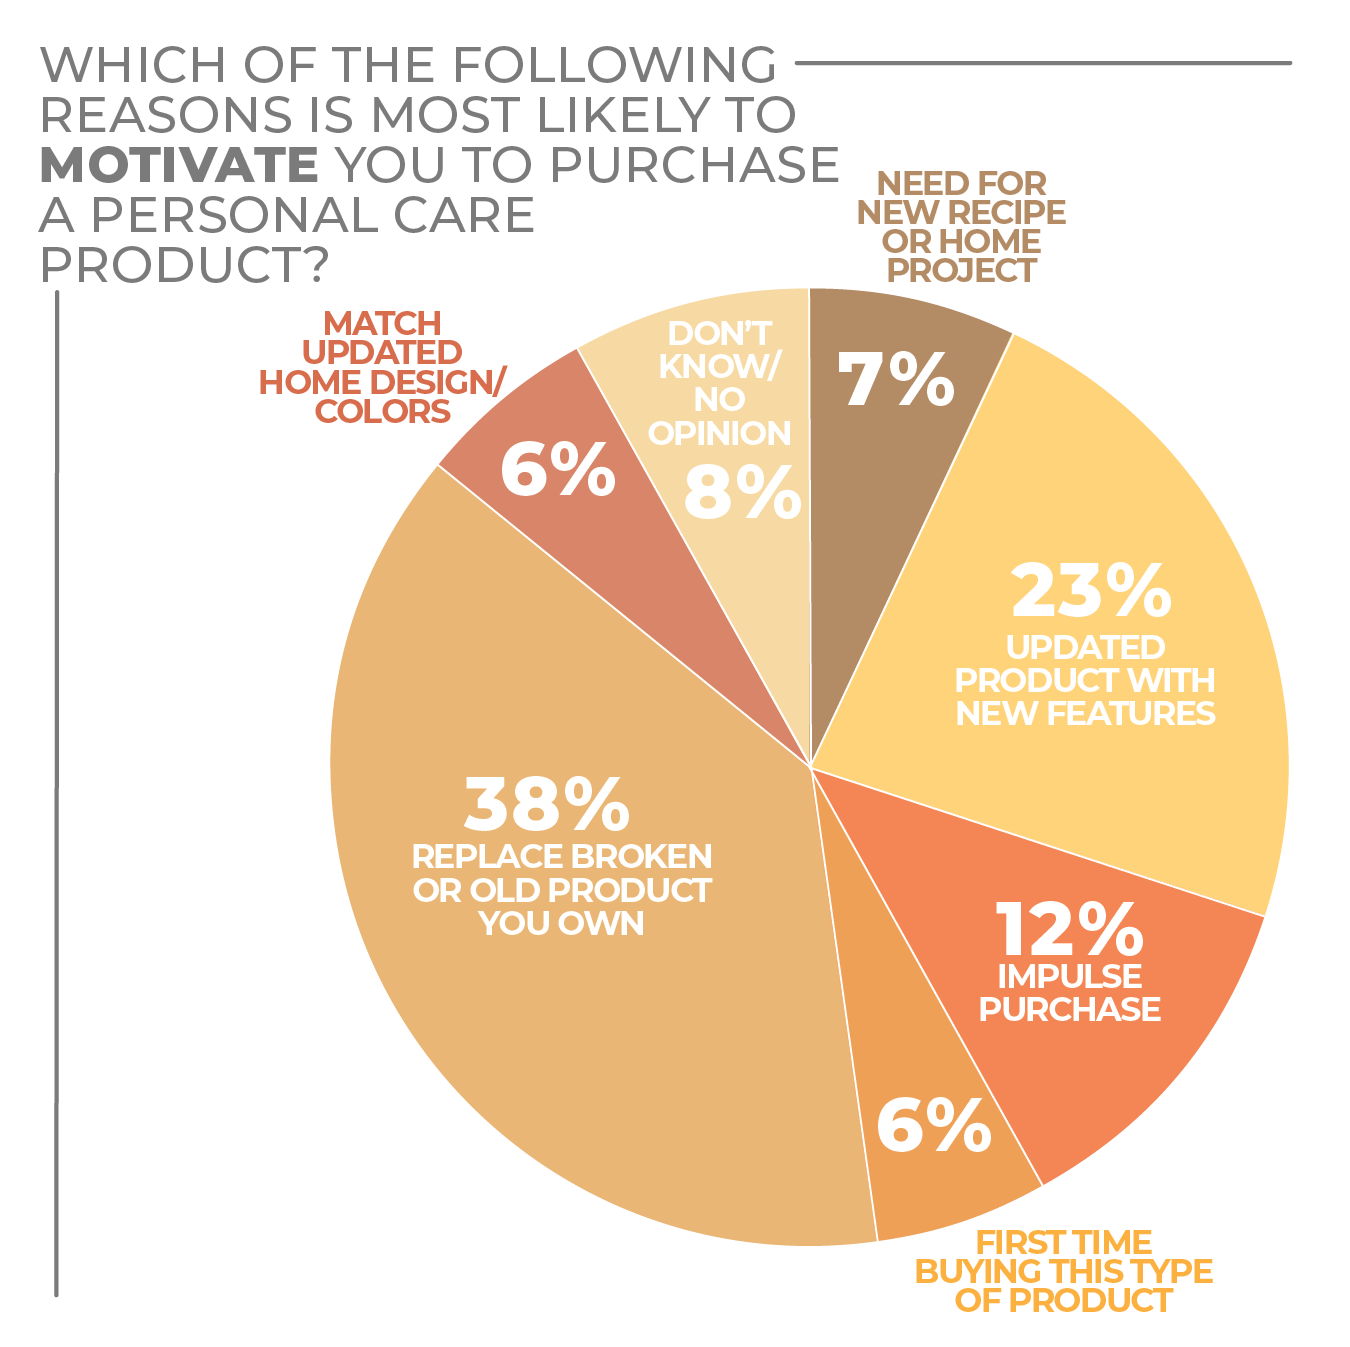
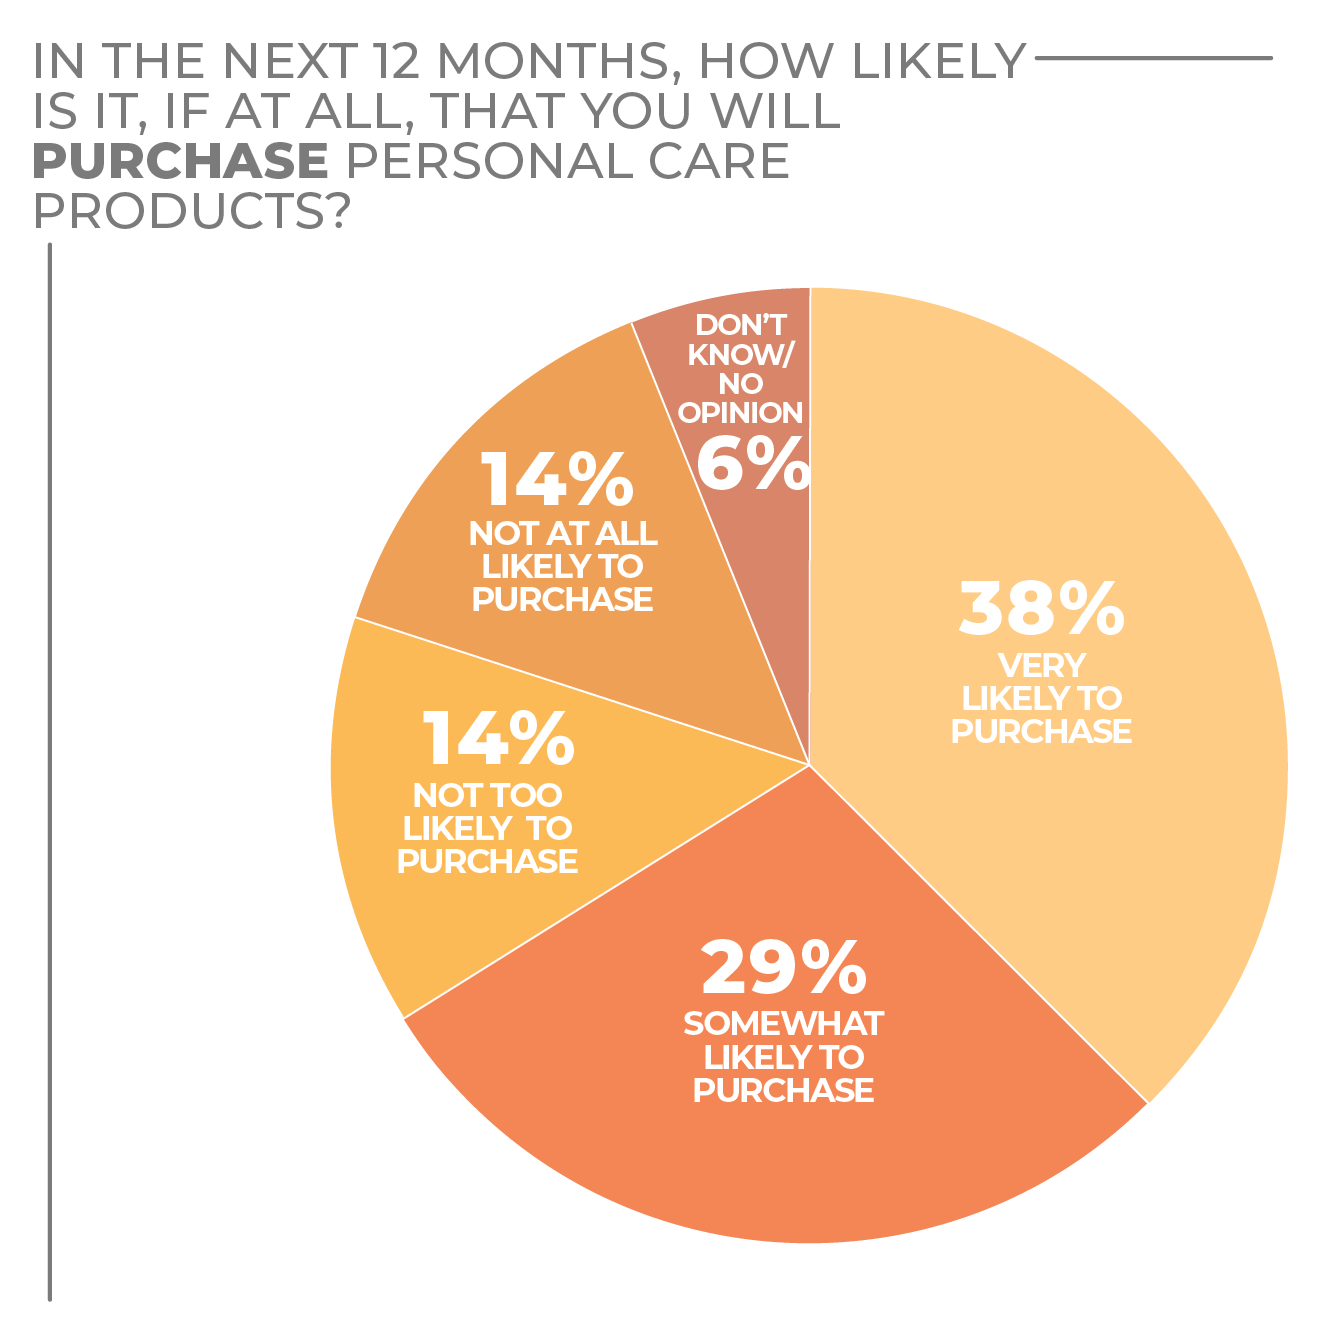
A lot of people are anticipating a purchase in the personal care and wellness category in the year ahead, suggesting purchases deferred during homebound periods are poised for a surge as consumers return to some sense of normalcy. In the HomePage News 2022 Consumer Outlook Survey, 38% of respondents said they were very likely and 29% said they were somewhat likely to purchase.
Many consumers are ready to trade up, too, as 23% of respondents said they would purchase an updated product with new features, and 12% said they could buy on impulse. Replacing a broken or old product, at 38%, was the primary motivation to purchase.
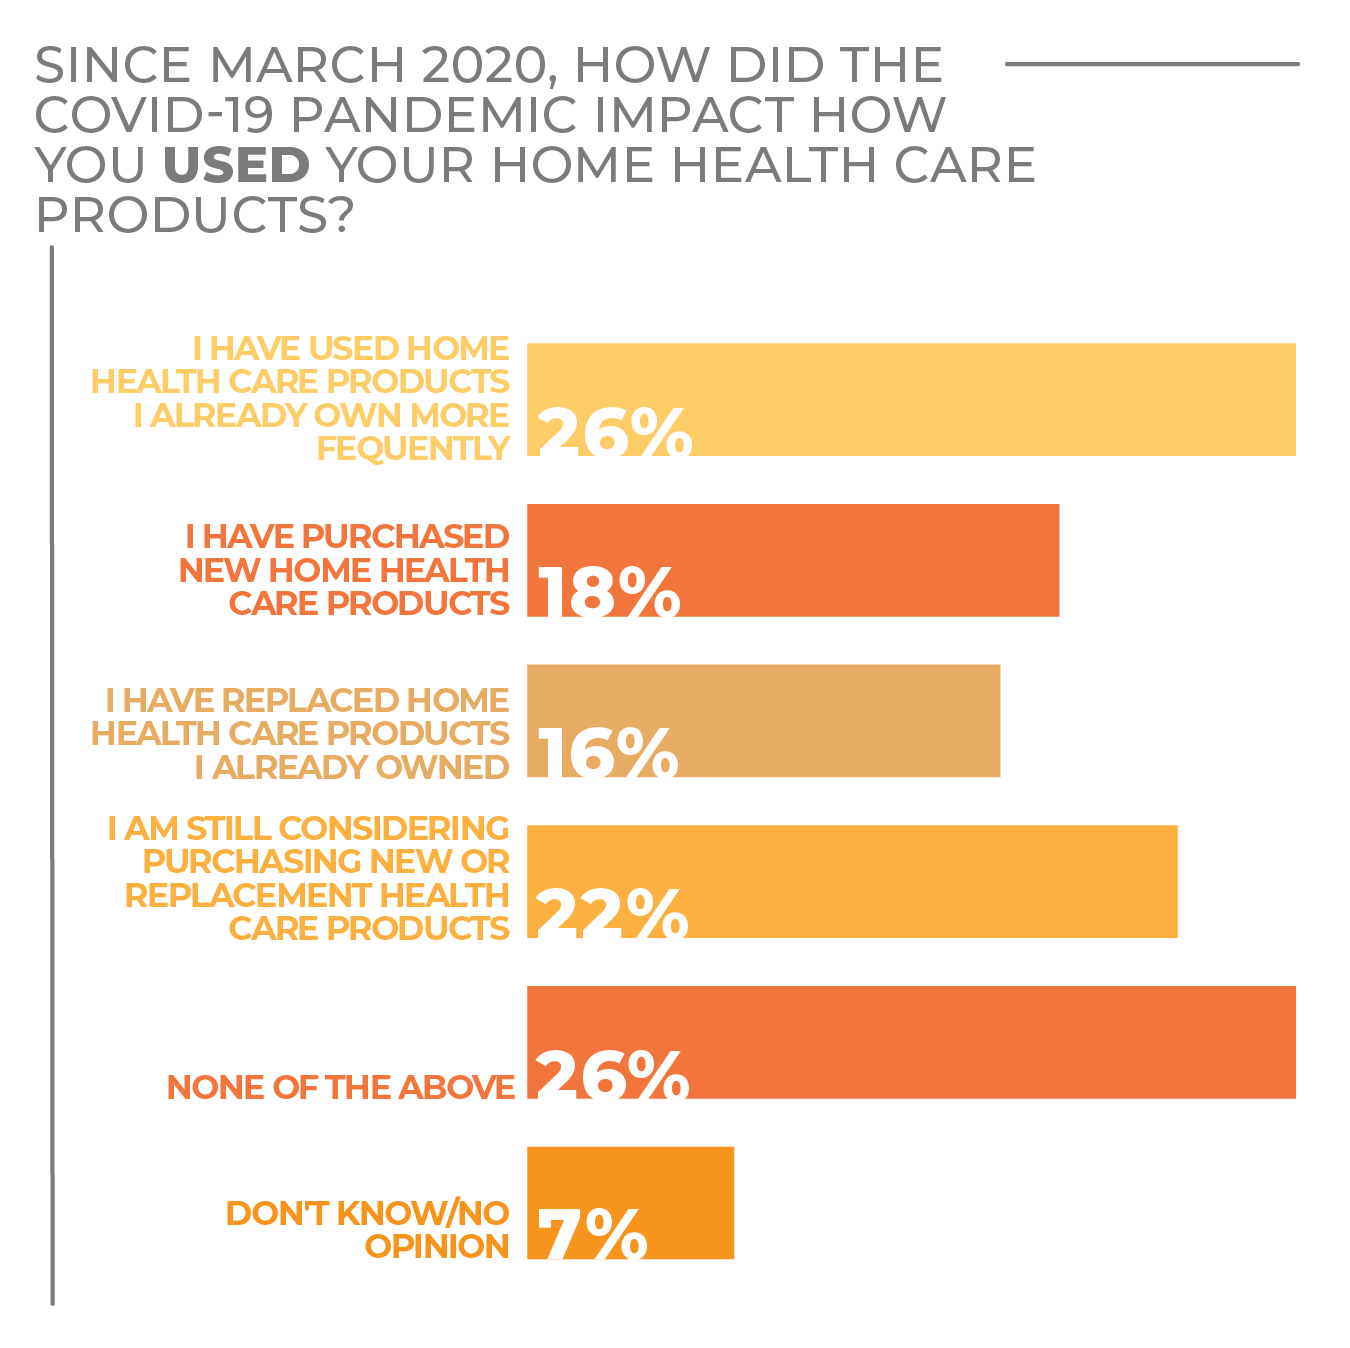
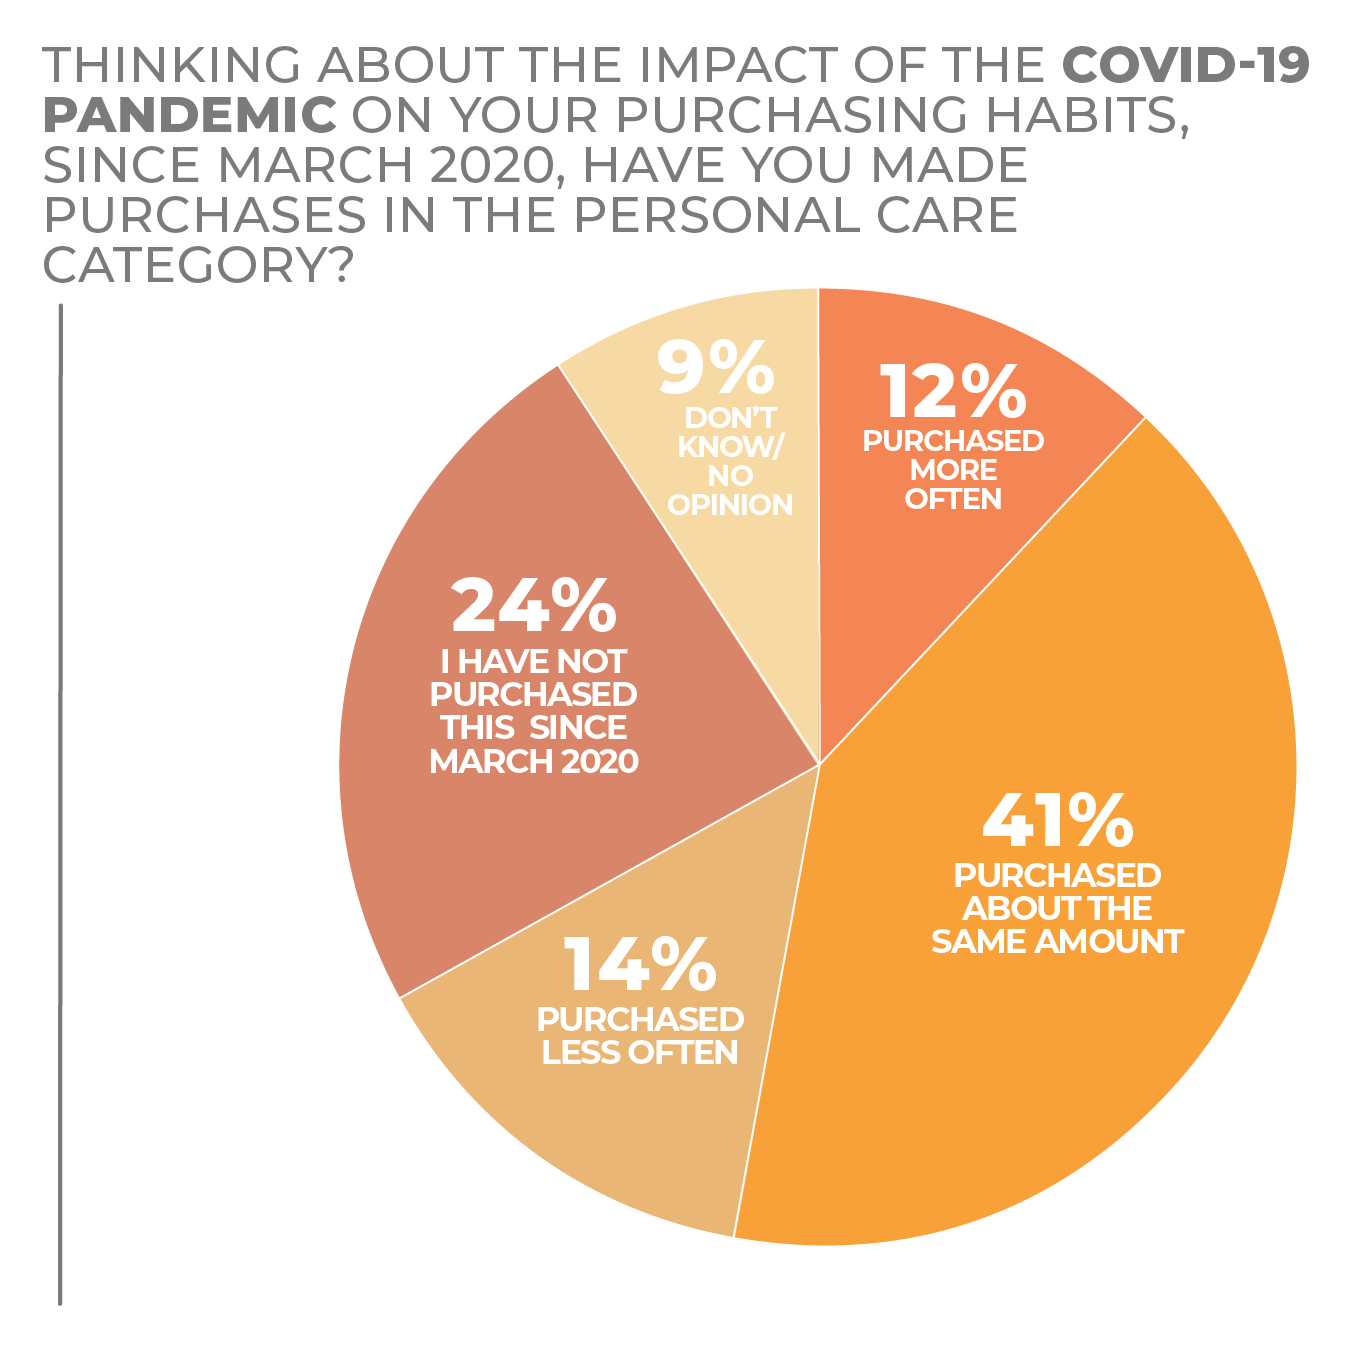
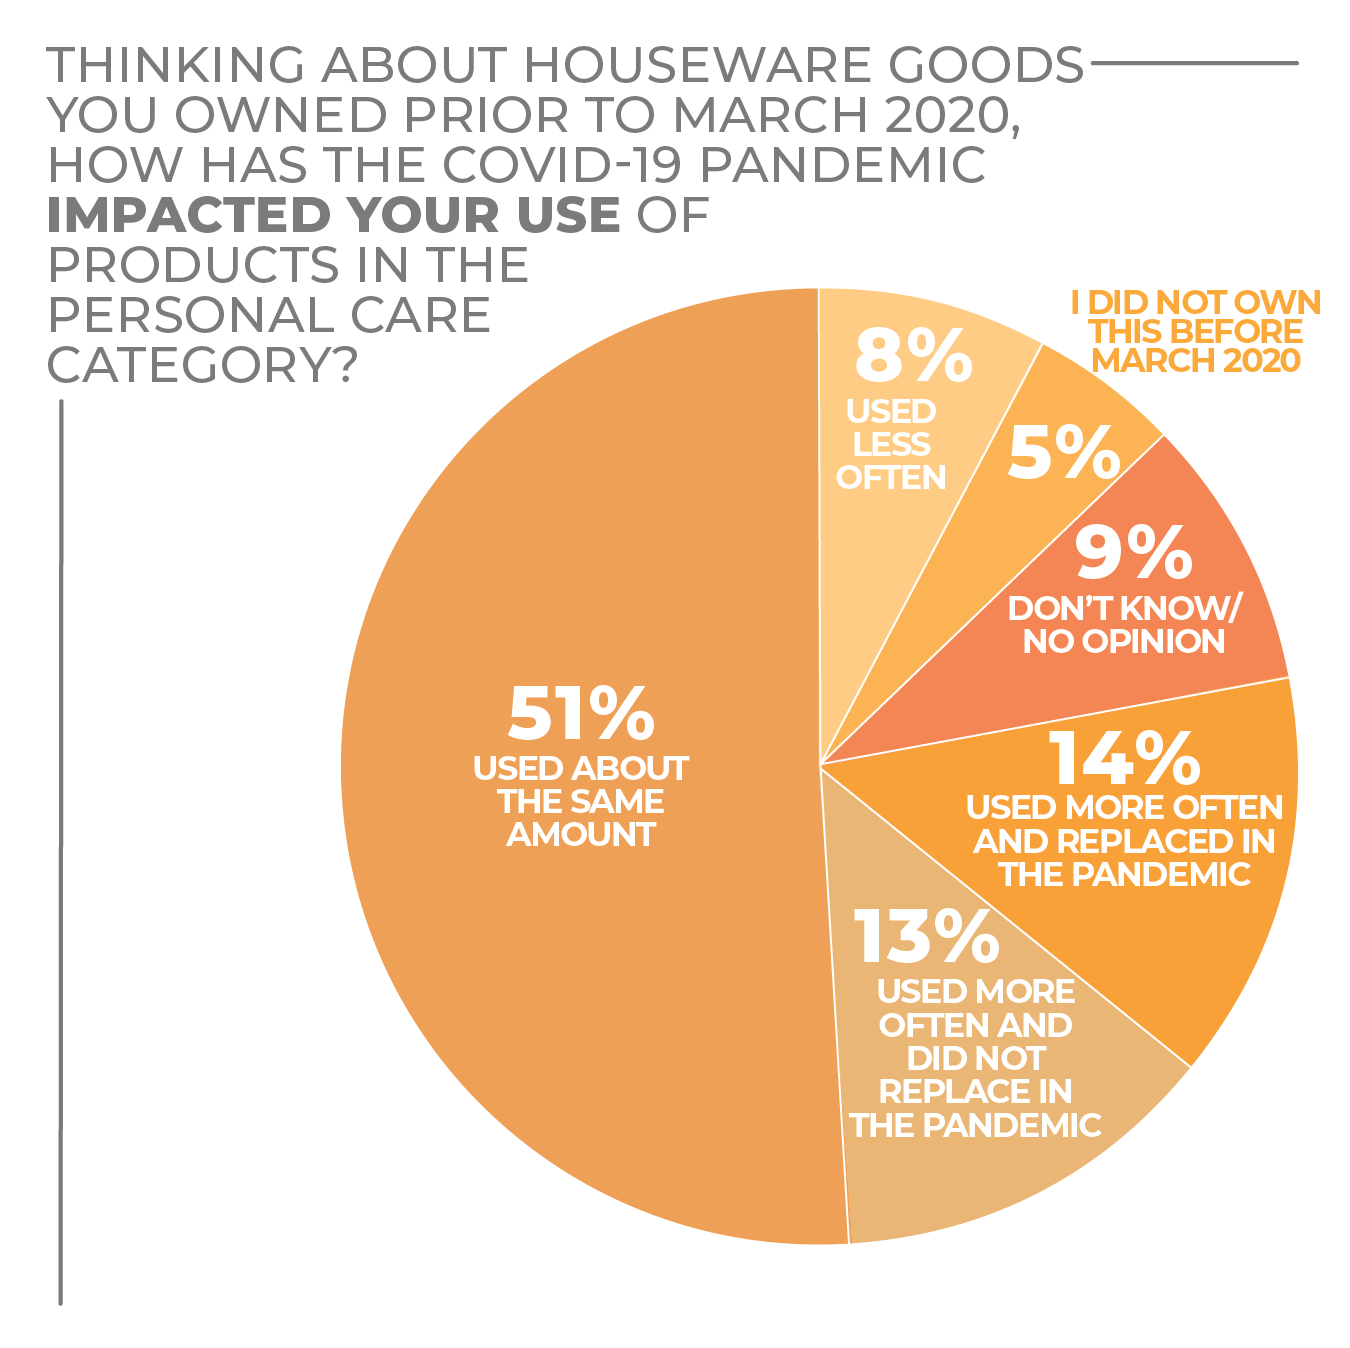
For some people, personal care and wellness have been important in their strategy to get through the pandemic. Some 14% of survey respondents said they used their personal care and wellness appliances more often during the pandemic and replaced them, and 13% saying they used them more often and didn’t replace them.
With just more than half of respondents using such products the same amount, a significant proportion of the consuming public may be primed to replace an old or worn-out product in the near future even if they aren’t trading up.
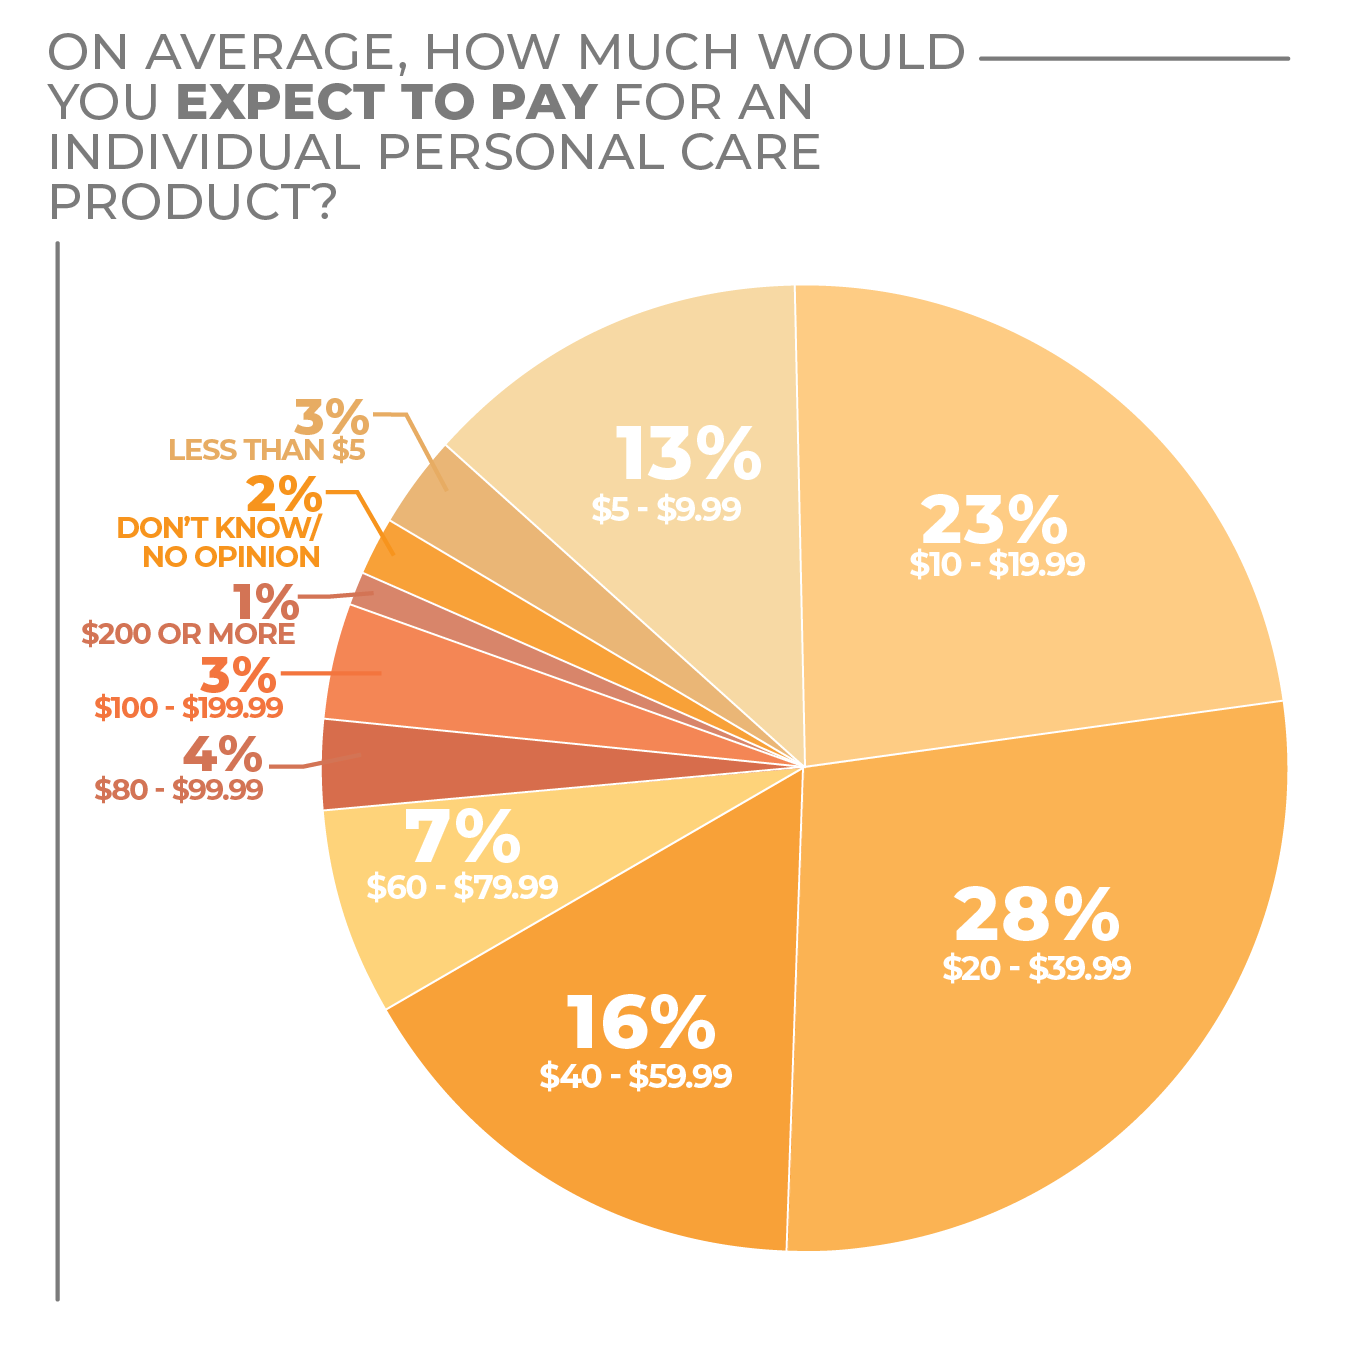
The sweet spot for personal care and wellness appliances was between $10 and $39.99, the amount just more than half of respondents expected to pay.
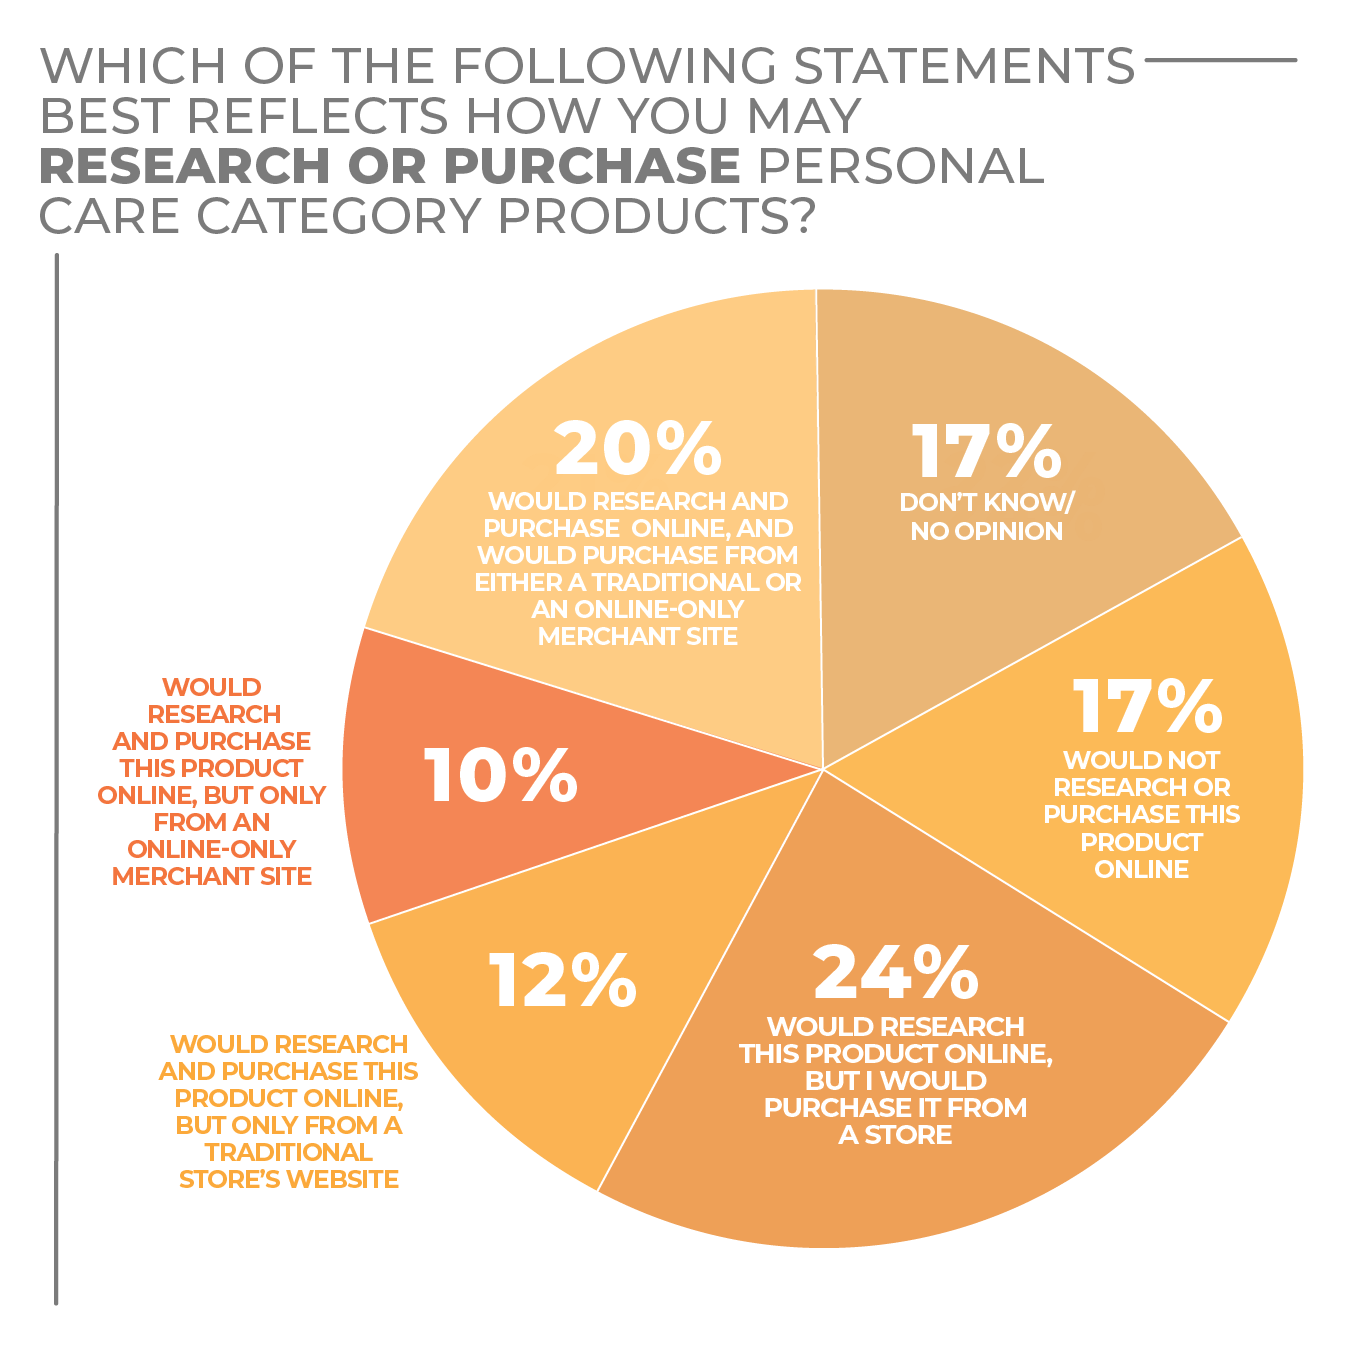
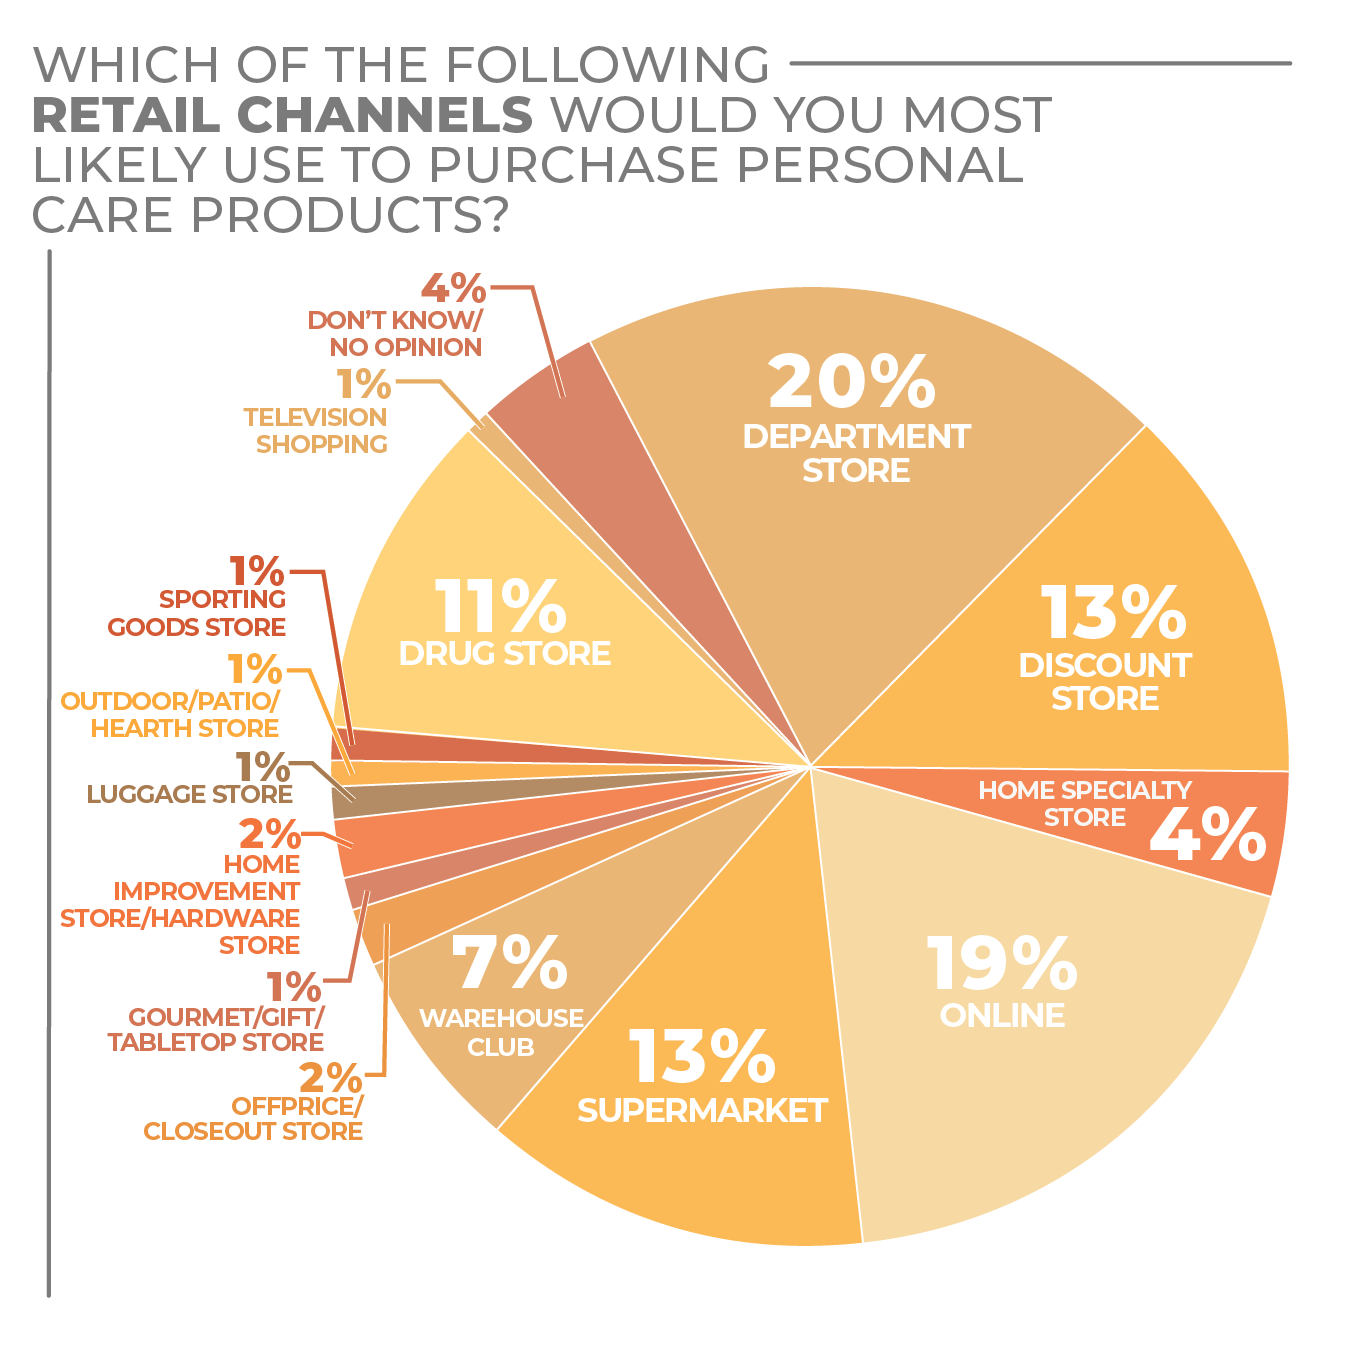
Although the department store/discount store duo paired to total a third of consumer purchasing consideration by channel, online had a strong 19% preference, and supermarkets came in at a perhaps surprising 13%, ahead of drug stores at 11%.
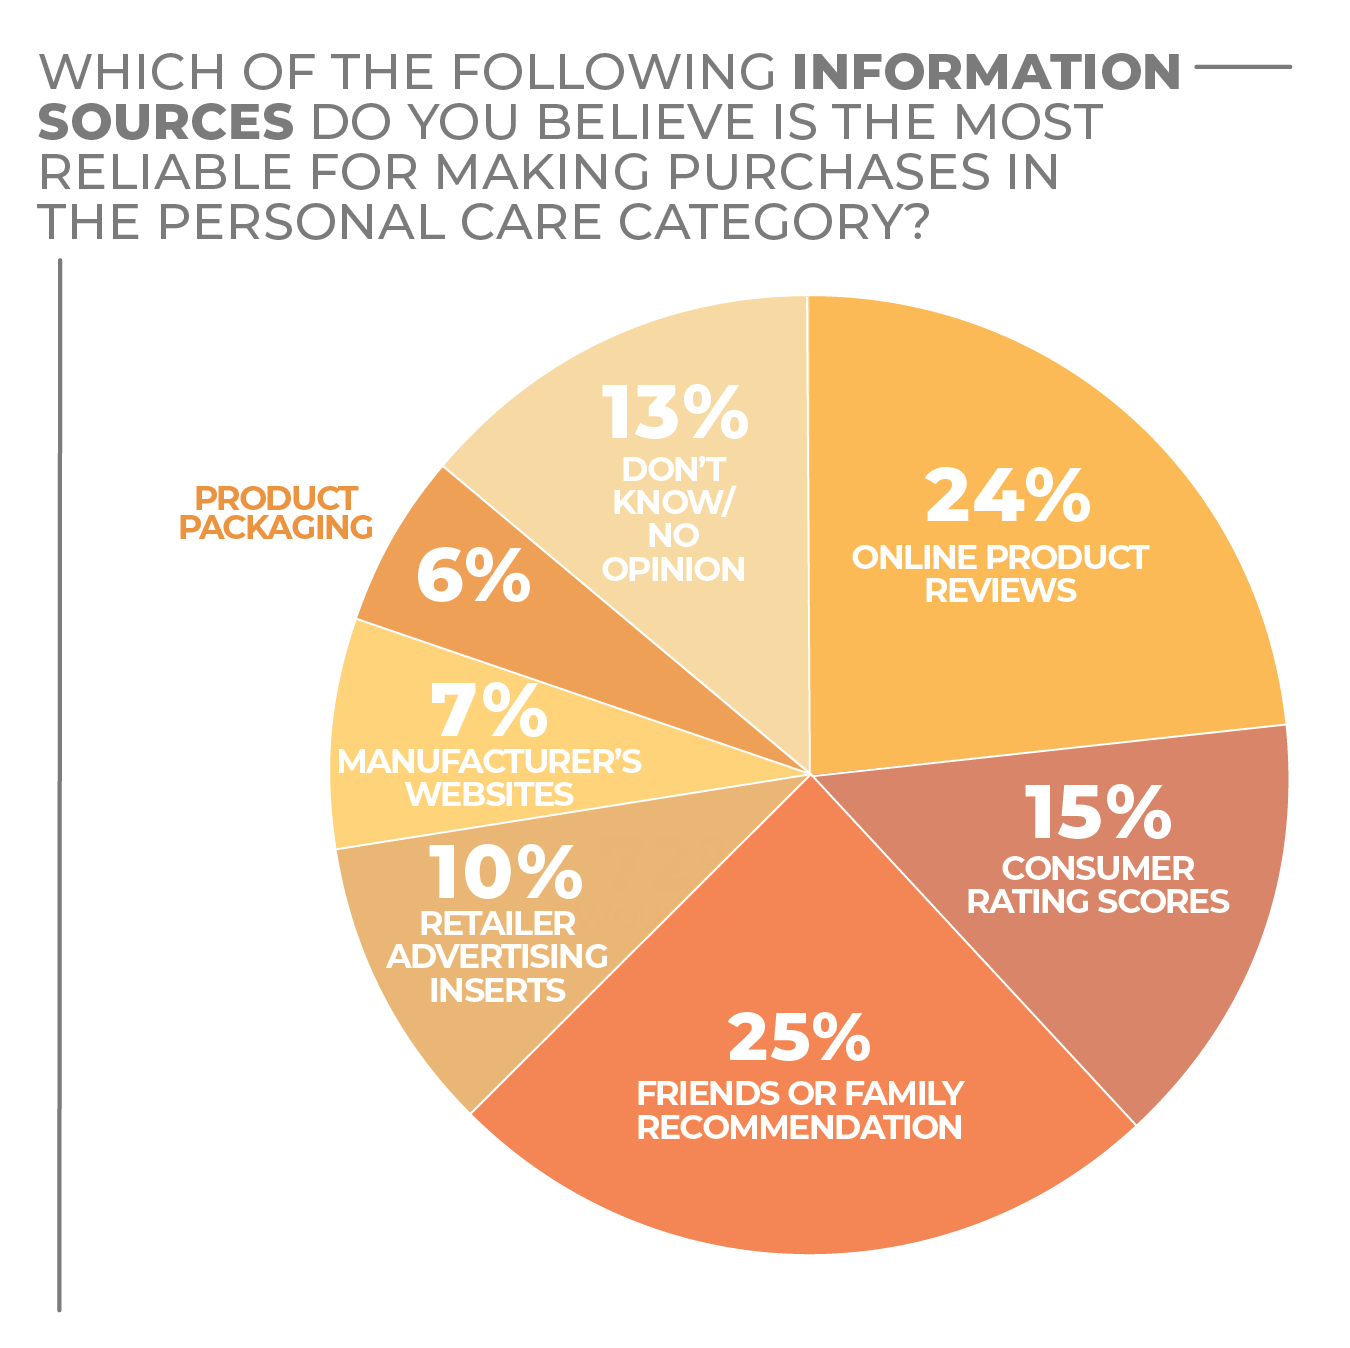
When it comes to research, personal care and wellness shoppers like the personal touch. A quarter favor family and friend recommendations when considering products to buy, and 24% count on online product reviews.
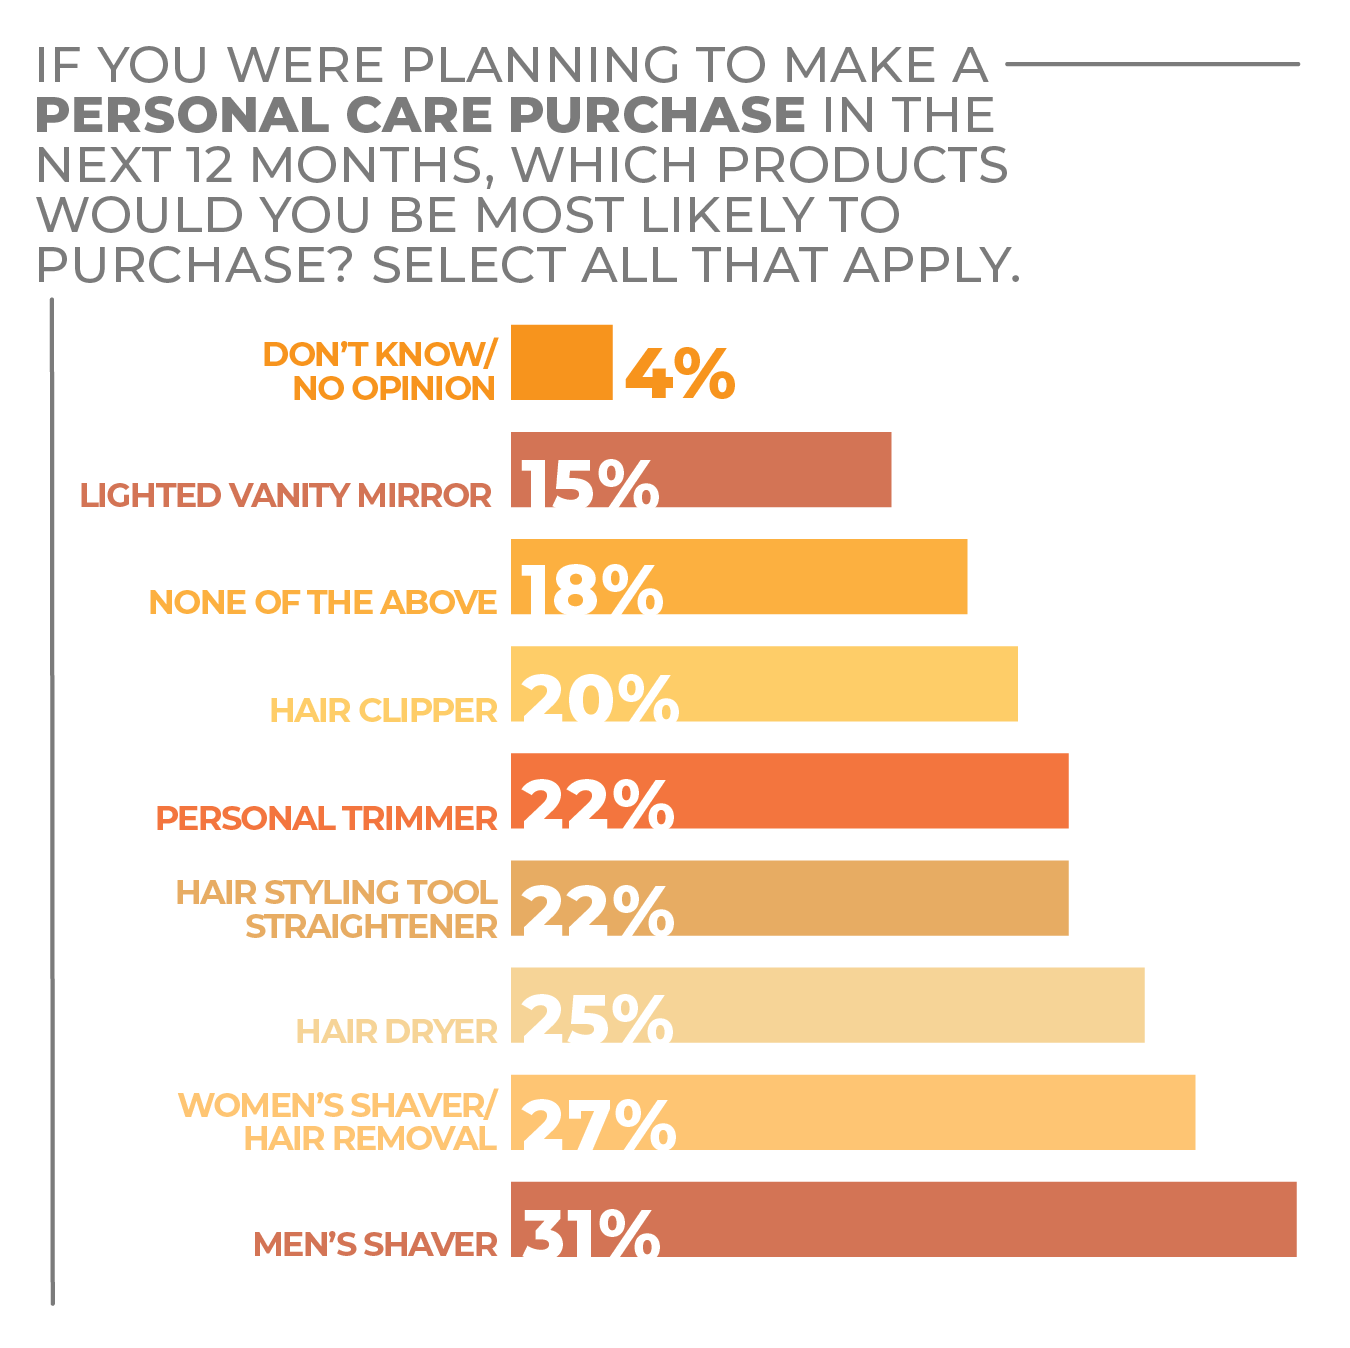
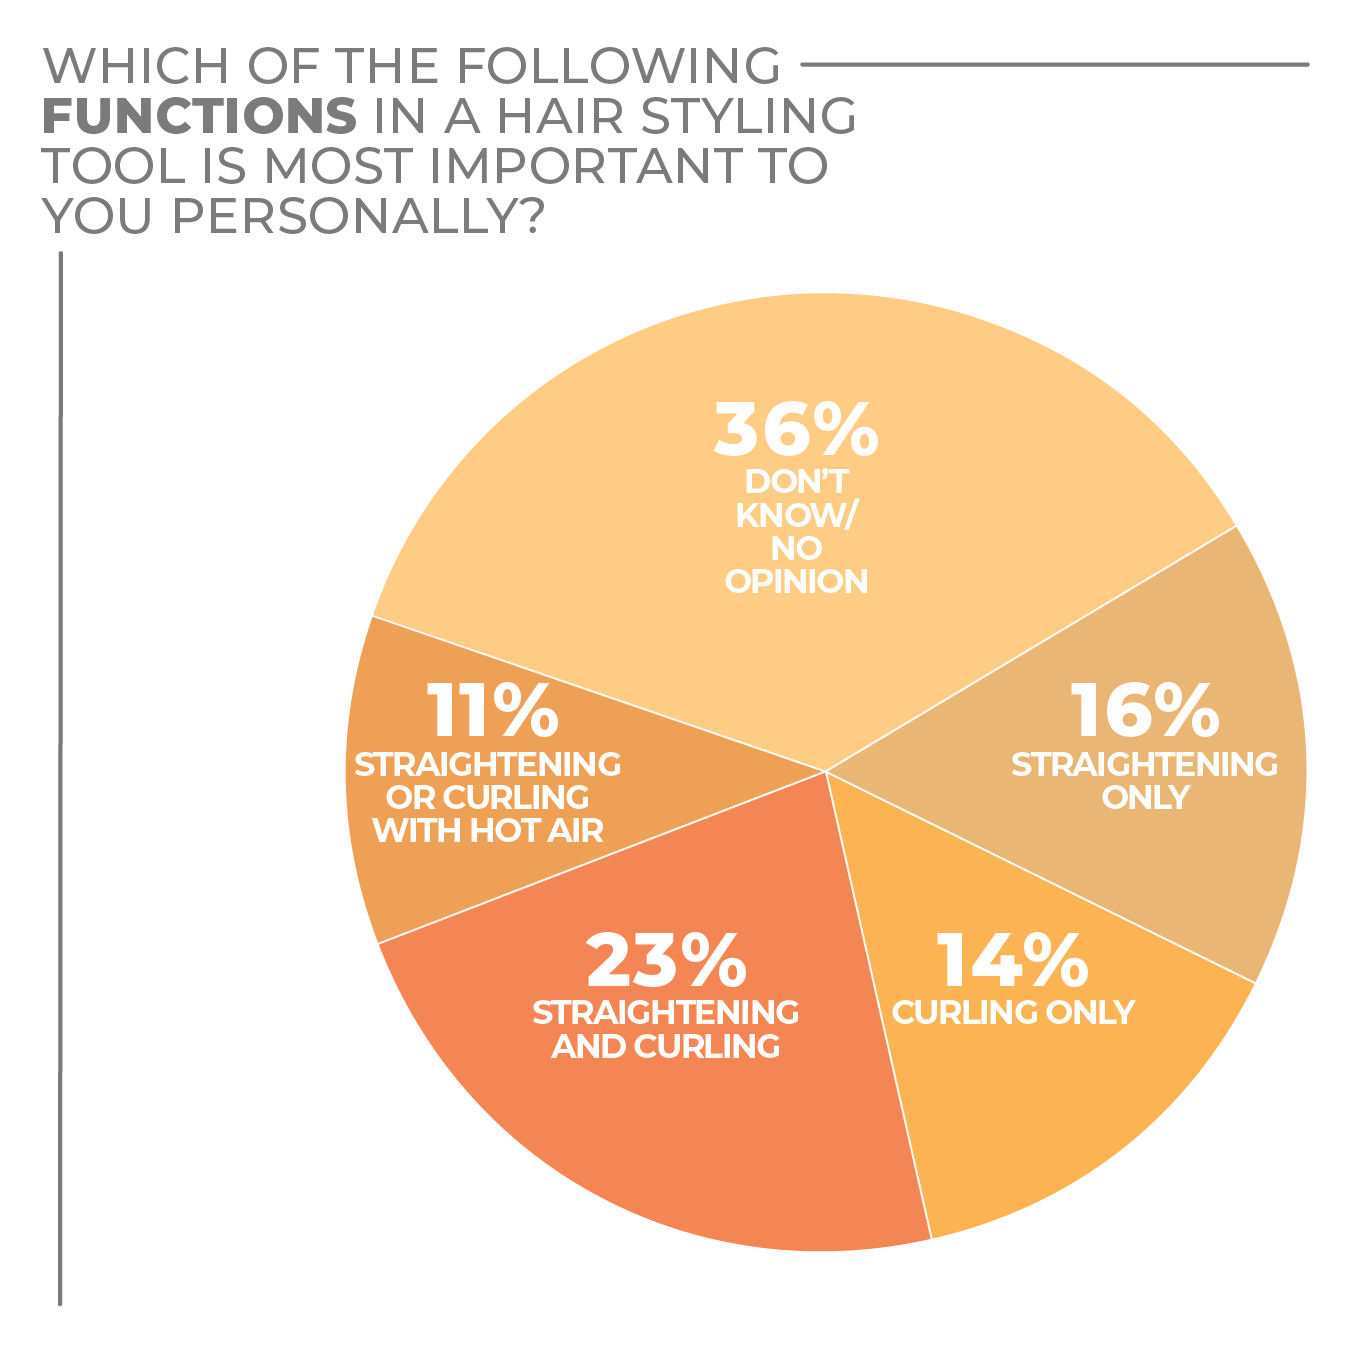
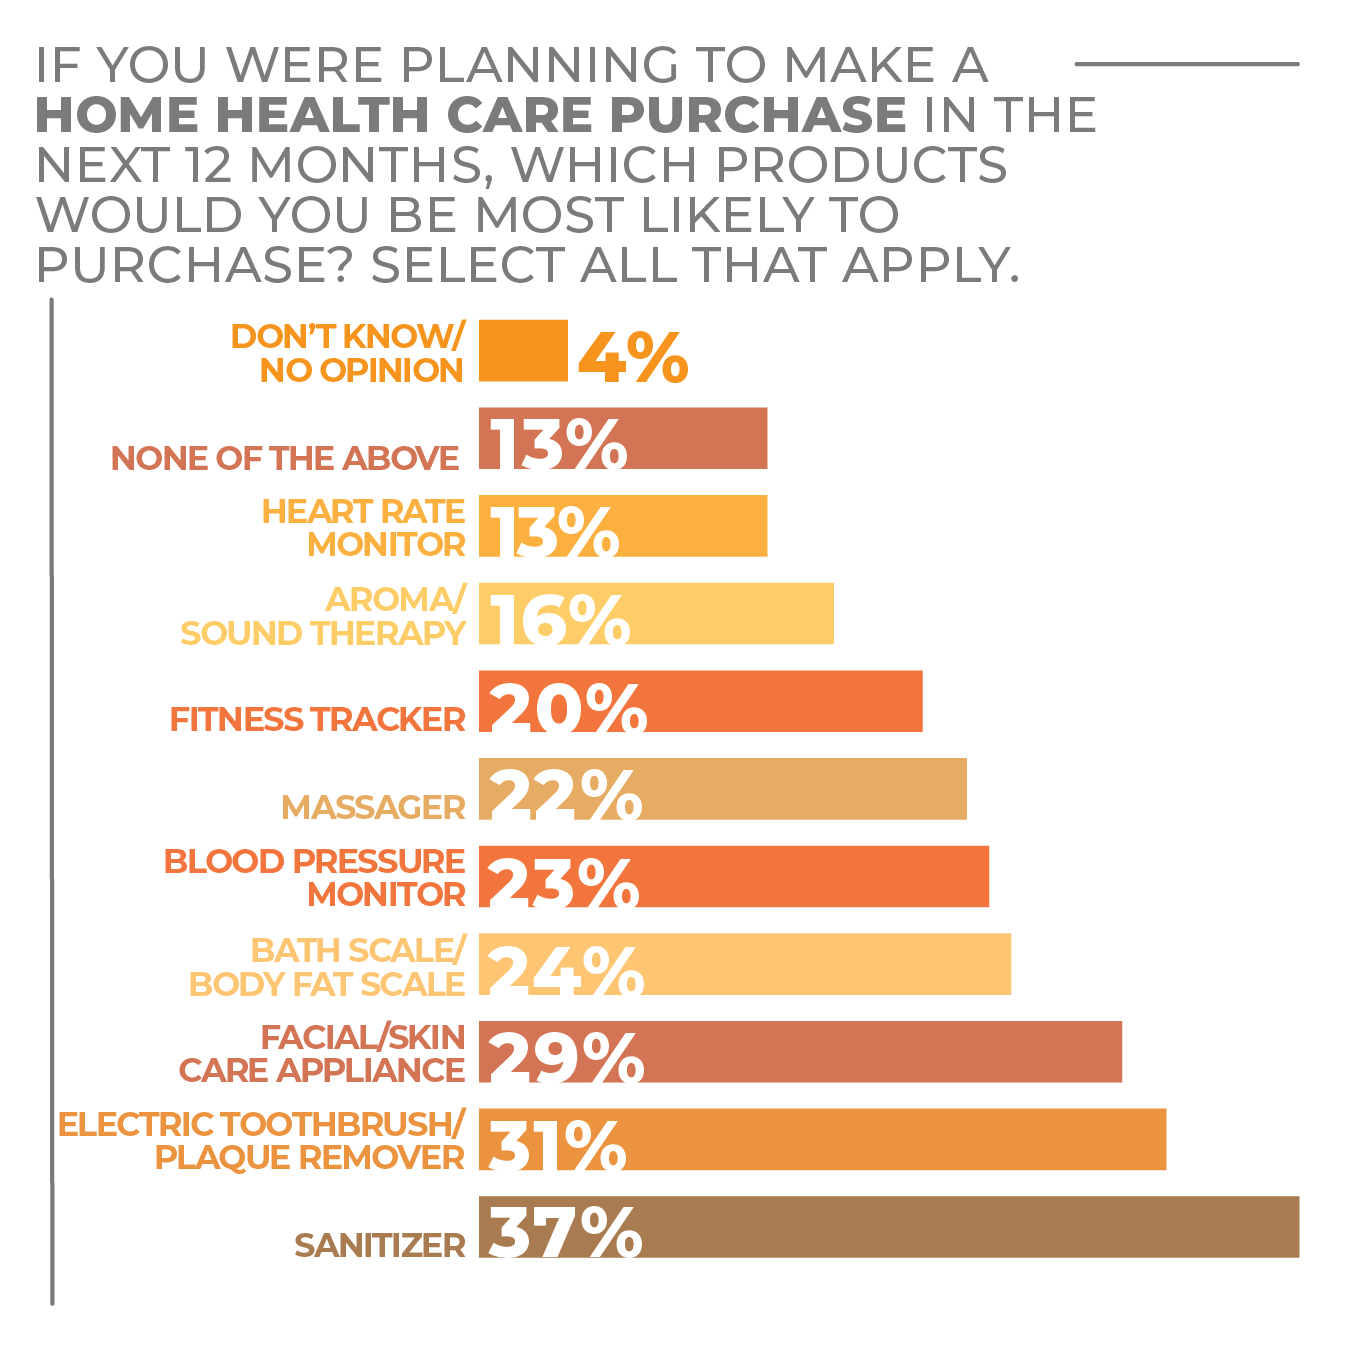
Among personal care appliances, men’s products got a strong response in the survey. Men’s shavers (selected by 31%) were most likely to be purchased in the year ahead. Personal trimmer tied for fourth at 22%, and hair clipper was fifth at 20%. Women’s shavers/hair removal took second place at 27%, hair dryer took third place at 25% and hair styling tool/straightener was tied for fourth at 22%.
Amid health-oriented appliances, the top preference of sanitizers isn’t surprising given the pandemic, with 37% of survey respondents citing such products as a likely purchase. Consumers remain committed to oral hygiene, with 31% favoring an electric toothbrush. Facial and skincare appliances followed at 29%, and bath scales were next at 24%.
From a demographic standpoint, women were more likely to plan a personal care and wellness product purchase, but not overwhelmingly so. As they looked at the year ahead, 40% of women responding to the survey reported they were very likely to make a purchase compared to 35% of men. Still, 30% of men said they were somewhat likely to make a purchase in the category versus 28% of women.
Millennials were the most likely to plan a personal care and wellness appliance purchase at 50% followed by Gen Zers at 44%, Gen Xers at 37% and Baby Boomers at 27%. Gen X and Gen Z were a bit ahead of the Millennials at 29%, in the somewhat likely category, trailed by Baby Boomers at 26%.
.
More Personal Care & Wellness Findings:

Click on charts to enlarge.

Storage & Organization
Home storage and organization are a safe bet for growth over the next several years as consumers continue to spend more time in their homes. Major retailers certainly seem to agree.
Recently, Target launched the Brightroom storage and home organization brand with a 450-item collection designed to offer affordable storage solutions that include everything from stackable clear plastic bins to breathable mesh for vegetable storage.
The Target launch follows Walmart’s introduction of clear storage for the pantry, bathroom and laundry room, developed in an exclusive collaboration with The Home Edit co-founders Clea Shearer and Joanna Tepli. In introducing the collection Anthony Soohoo, executive vice president, home, noted that, despite increased demand, 70% of Walmart customers told the company that they aren’t quite sure where to start when it comes to organizing their homes. Need and uncertainty breed opportunities for companies willing to out and grab it.
Bed Bath & Beyond is yet another retailer that recently introduced a storage brand. In July of last year, it rolled out the Squared Away brand, asserting that, after months sticking close to home, consumers faced challenges organizing work, school and personal needs in limited space. In response, the line included storage, organization and laundry care products for home, apartment and dorm room.
However, no retailer may envision more future opportunities in storage than The Container Store. Lately, it has touted new storage collections from partnerships focused on small vendors including The Home Edit by iDesign Wooden Collection of renewable paulownia wood items; Blueland reusable cleaning spray bottles and related tidying aids; and Cricut home label cutting machines.
Still, that only scratches the surface of The Container Store’s ambitions. Early in 2022, The Container Store announced that it had acquired Chicago-based home storage solutions and closet organization company Closet Works for $21.5 million, which the retailer termed a strategic acquisition that will expand the range of premium wood-based products it can offer customers who want to refine their closets, garages, home offices, pantries, laundry rooms and even Murphy beds.
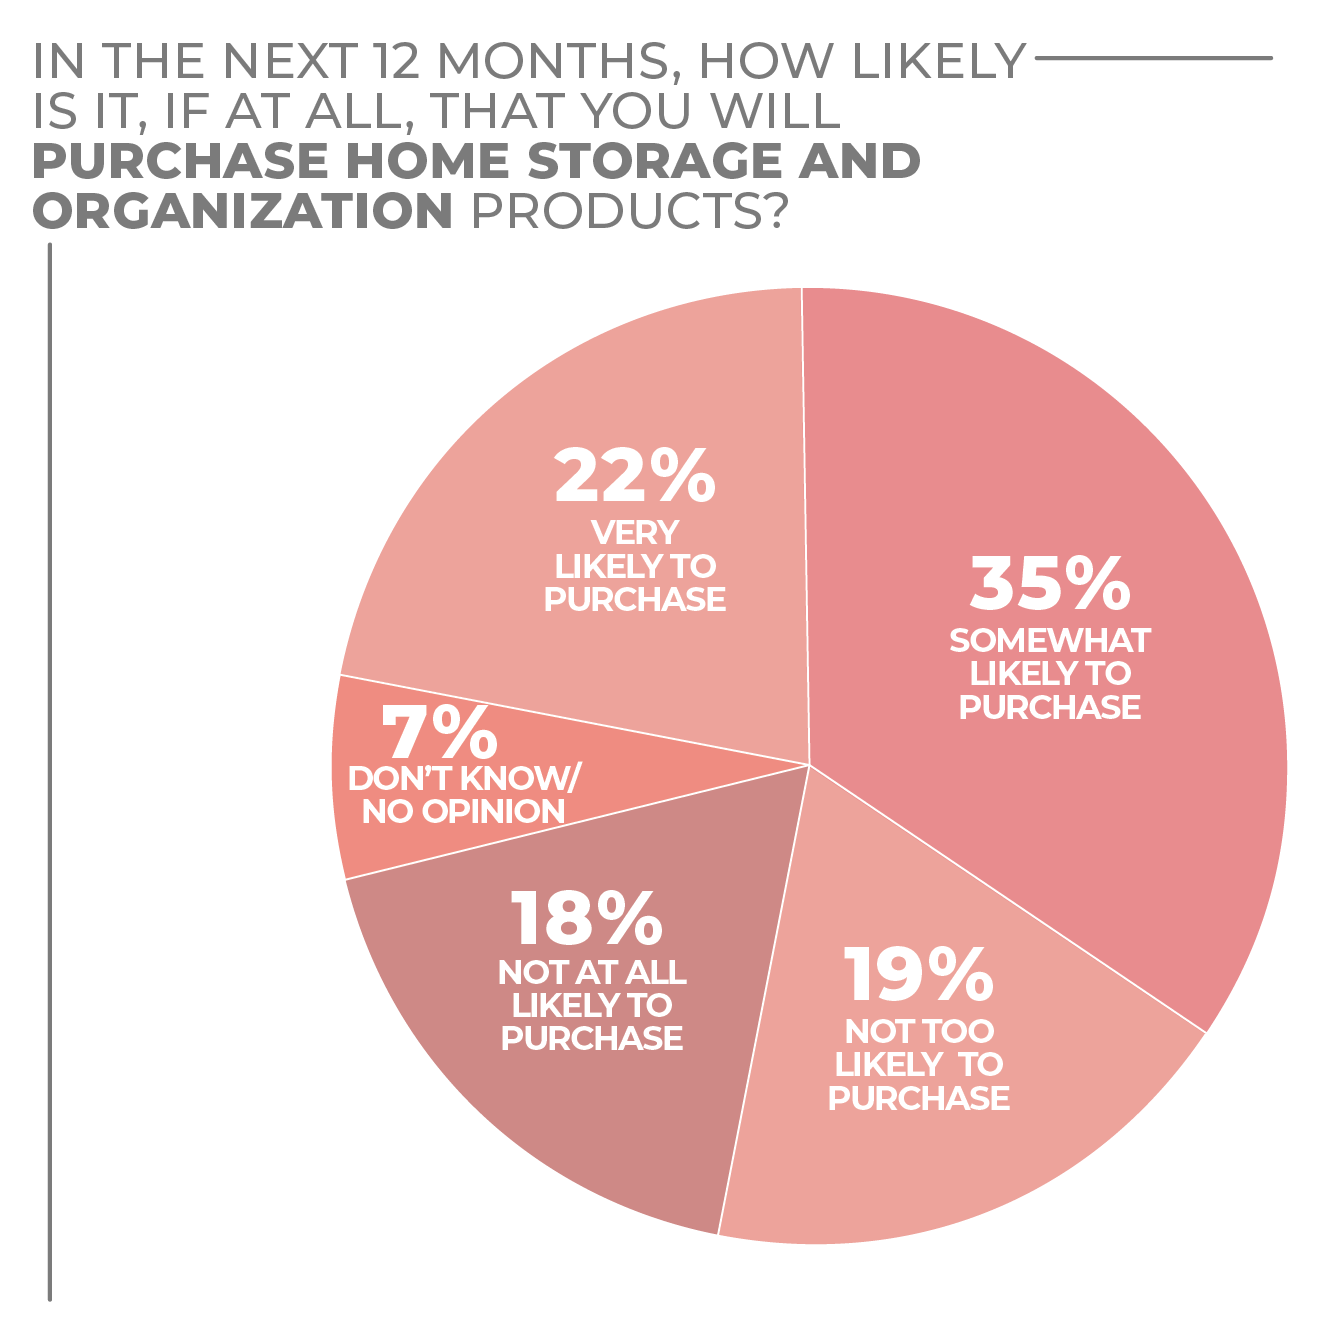
Respondents to the HomePage News 2022 Consumer Outlook Survey demonstrated that the desire for home storage and organization products is consistent across the country with the Northeast, at 24% of consumers very likely to purchase, just slightly ahead of the other regions across the United States. Still, the Midwest is the narrow leader in the somewhat likely designation.
Wherever you go, though, more than half of consumers say they are very or somewhat likely to purchase a home storage and organization product in the months ahead.
In regard to gender, women are more enthusiastic about the category, with 23% very likely and 34% somewhat likely to purchase as opposed to men at 20% and 34%, respectively. In both cases, more than half of consumers expressed at least some desire to buy.
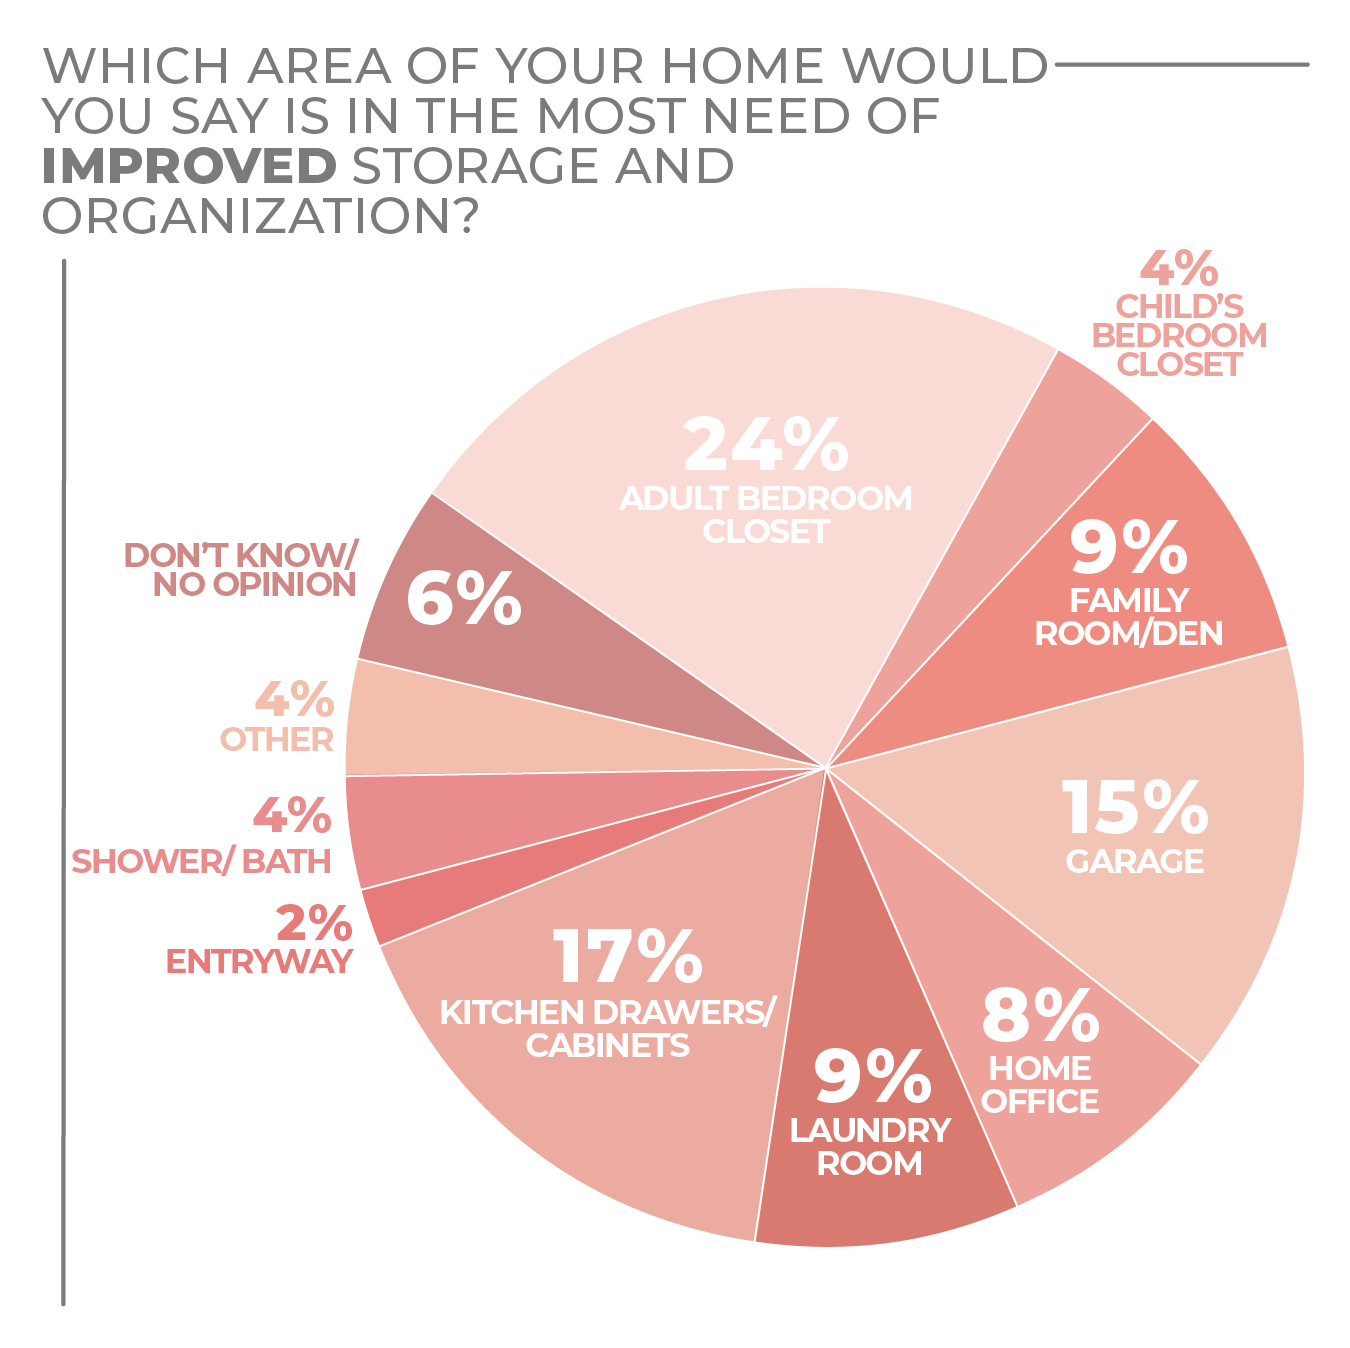
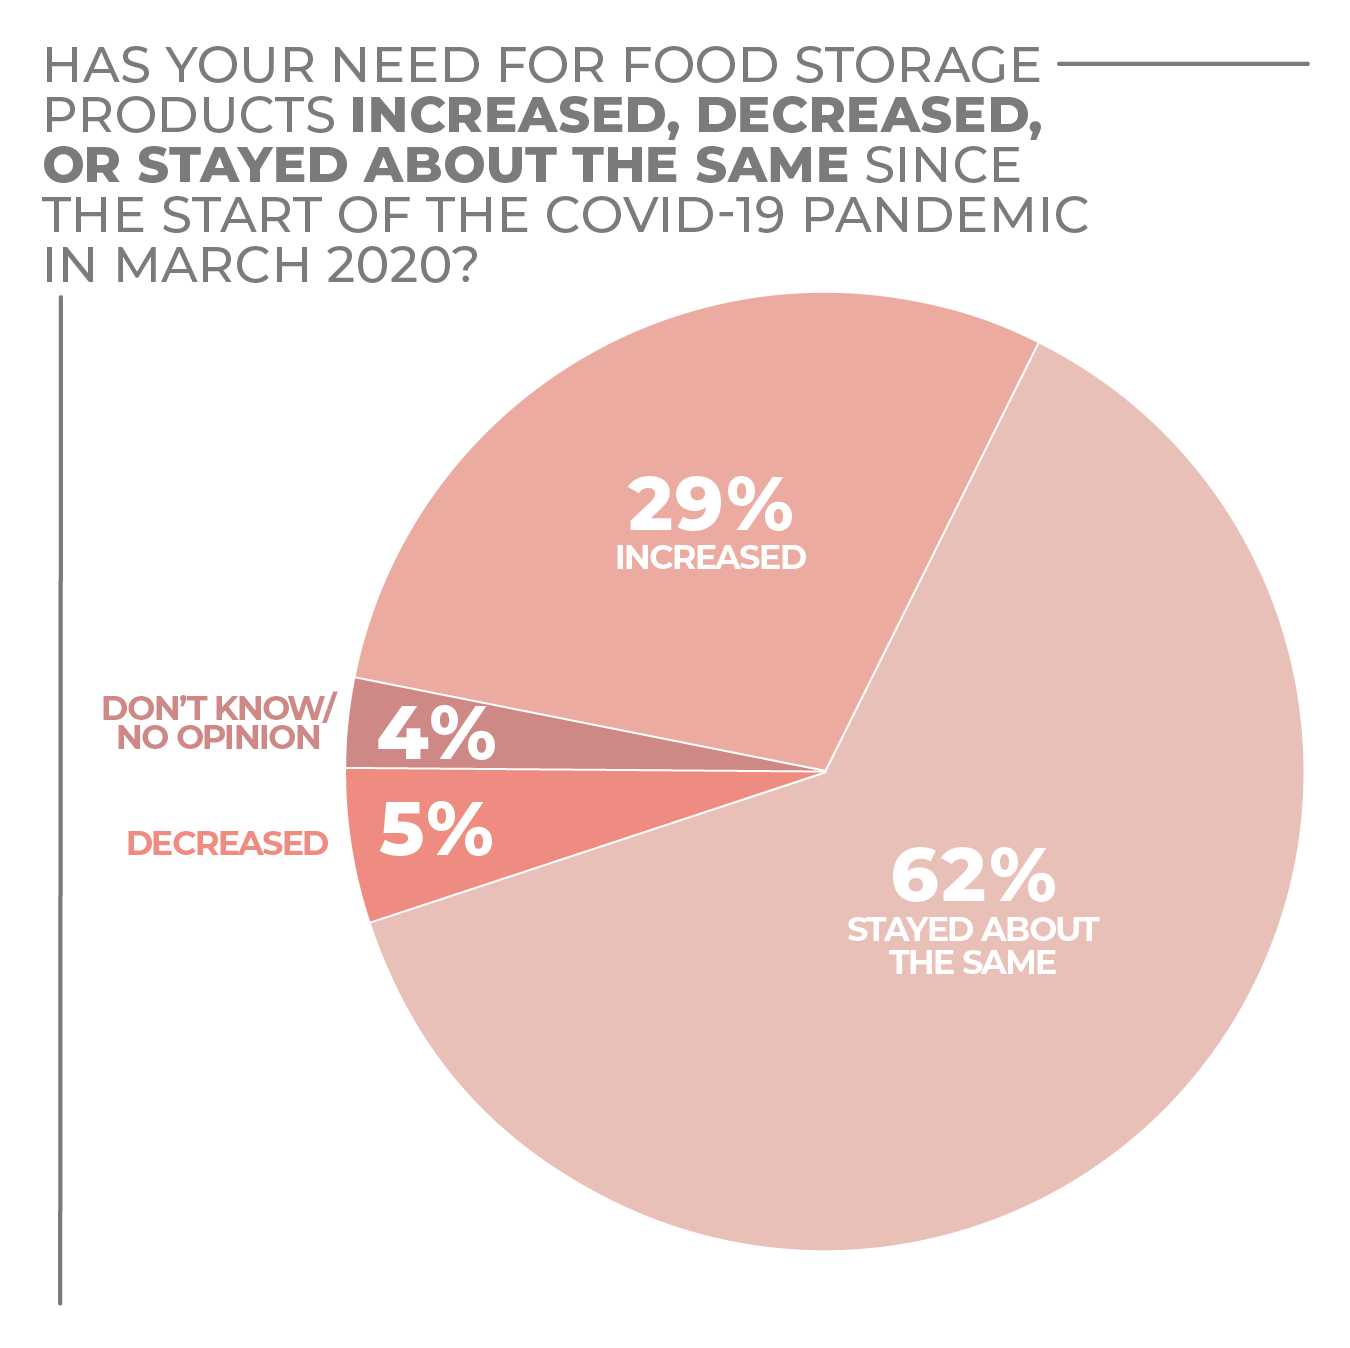
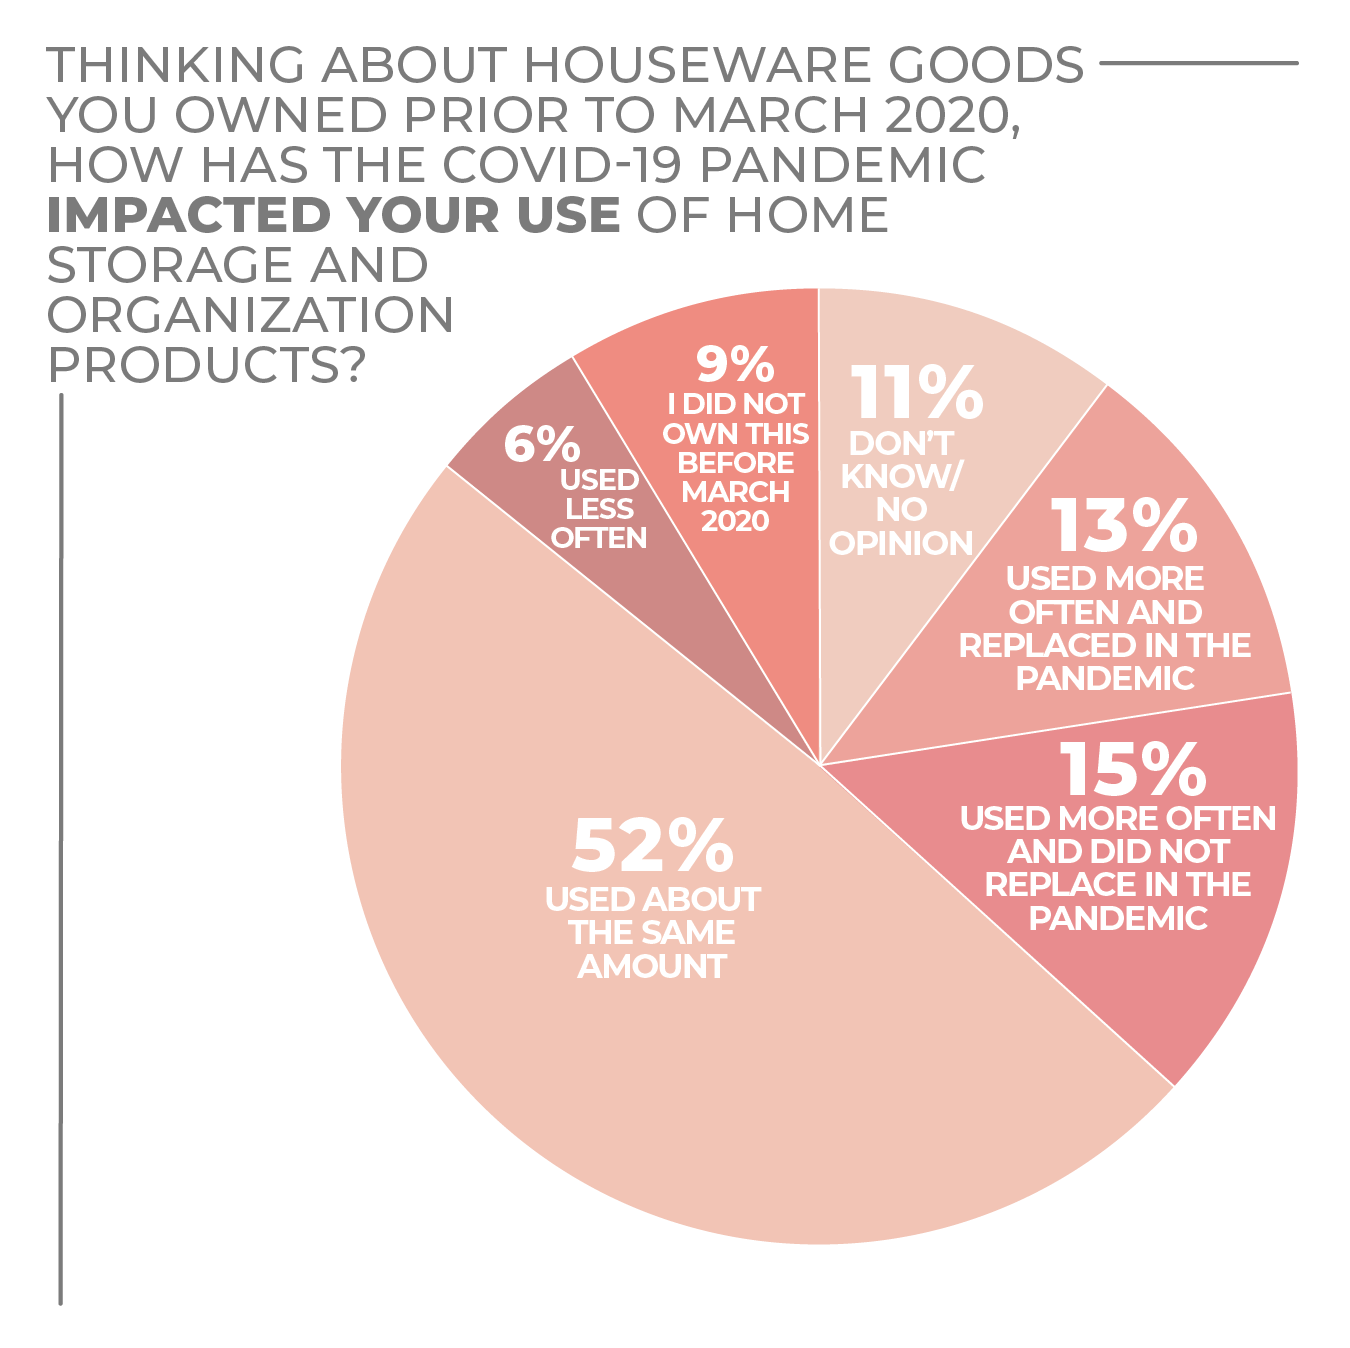
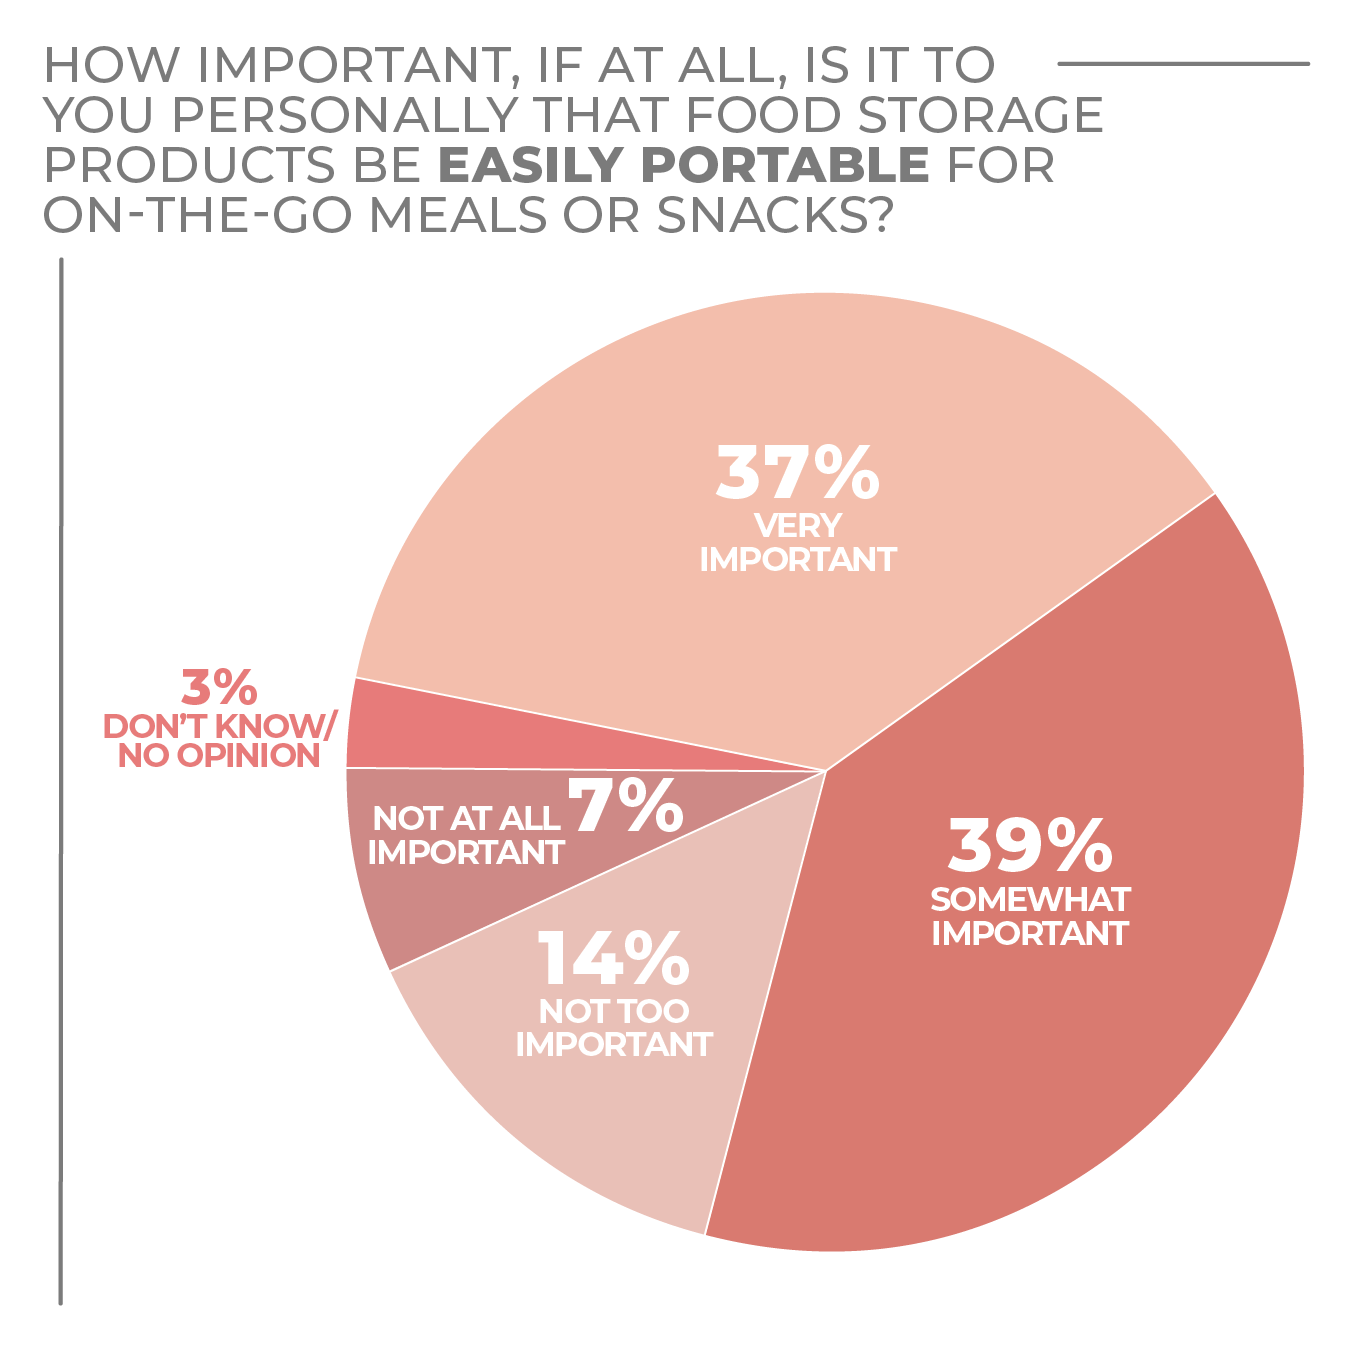
The segments in which consumers are most likely to purchase are food storage, closet organizer and hamper/laundry basket. Given those numbers, it’s not surprising that 24% of consumers say that an adult bedroom closet is the place in their homes in the most need of organization, with kitchen drawers and cabinets following. With consumers returning to work and school, 39% of consumers are somewhat interested and 35% are very interested in the portability of food storage. In terms of use, only 5% of consumers say their need for food storage products has decreased recently.
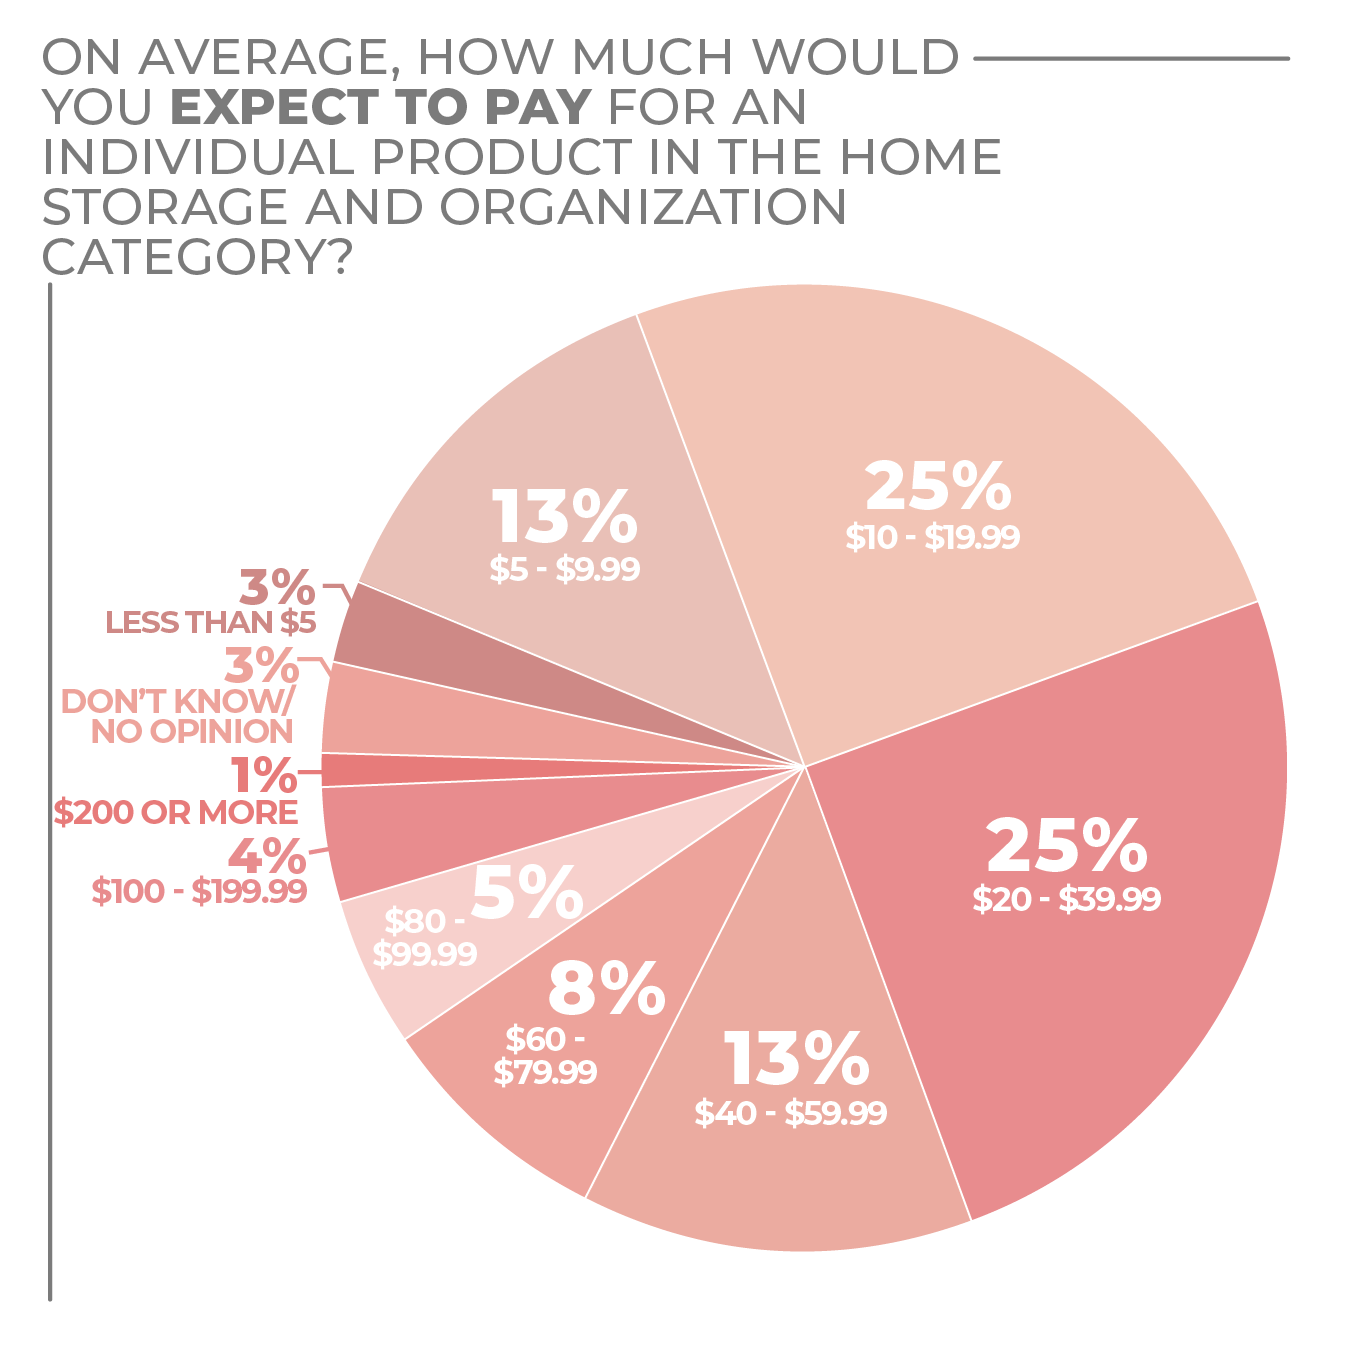
The sweet spot for retail pricing is $10 to $39.99, as half of the survey respondents said that’s the range in which they expected to pay. Still, more than 30% said they expected to pay more, suggesting that home storage and organization is important enough to many consumers that they will invest in the more expensive items and product categories.
More Storage & Organization Findings:
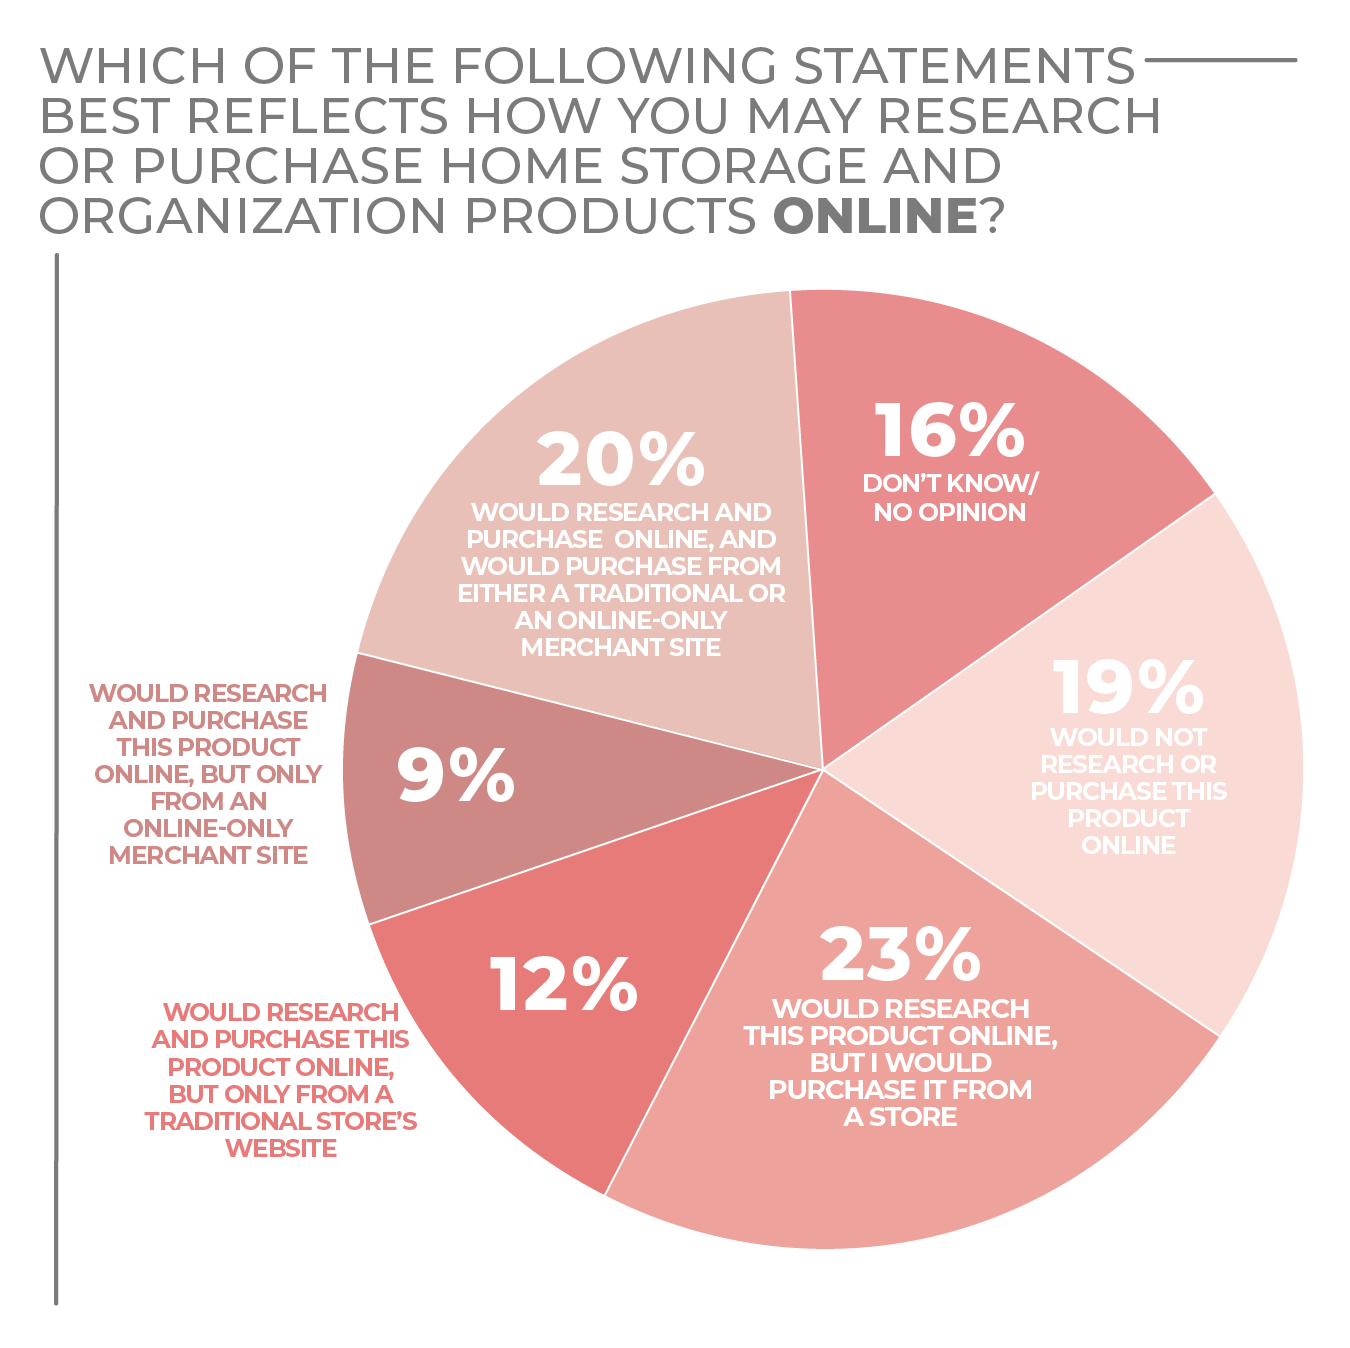
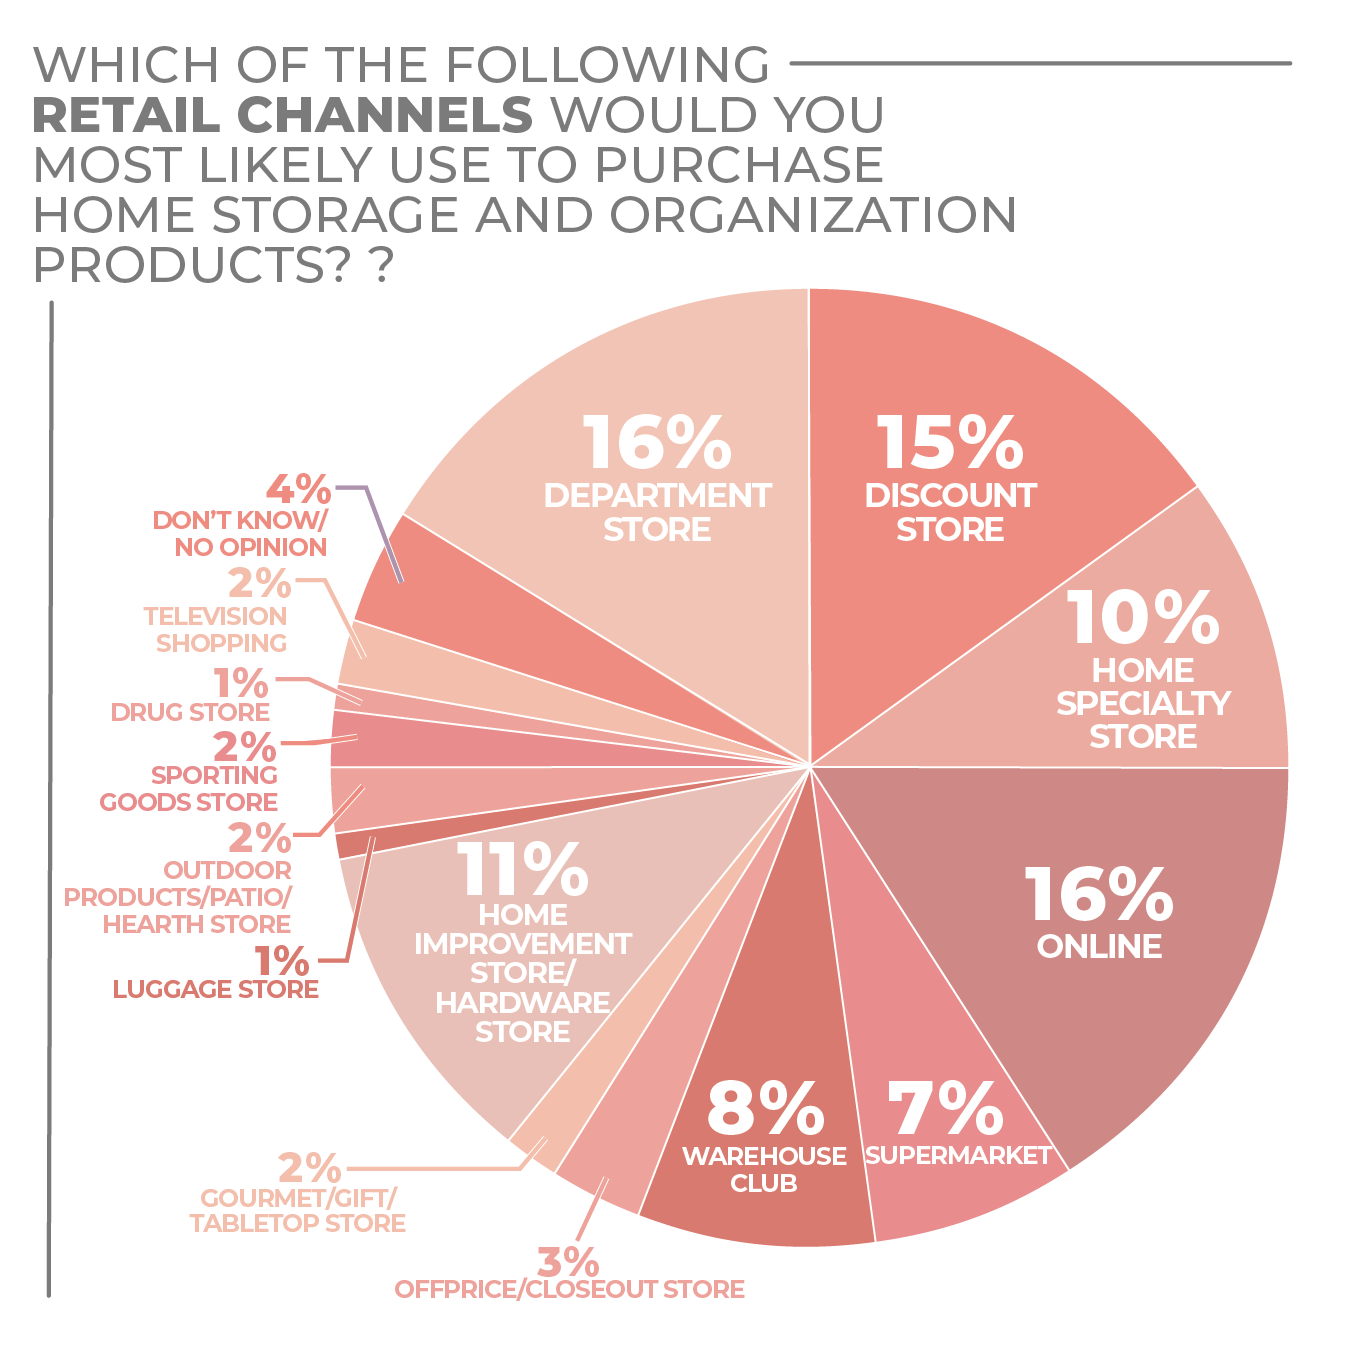
Click on charts to enlarge.

 Bakeware
 Cleaning Tools
 Cookware
 Cutlery
 Dinnerware
 Drinkware
 Flatware
 Floor Care Electrics
 Glassware
 Home Environment
 Kitchen Electrics
 Kitchen Textiles
 Kitchen Tools & Gadgets
 Personal Care & Wellness
 Storage & Organization